Abstract
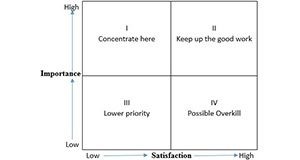
This is the second document in the Importance-performance Analysis series, a series of three about using importance-performance analysis (IPA) to prioritize Extension resources. This 4-page article covers how to collect data and use them to generate visual plots. IPA data plots are attractive and easy-to-understand visual maps that display importance and satisfaction scores for certain attributes. Written by Anil Kumar Chaudhary and Laura A. Warner, and published by the Department of Agricultural Education and Communication, May 2016.
References
Bertram, D. (2006.) Likert scales. Retrieved from http://my.ilstu.edu/~eostewa/497/Likert%20topic-dane-likert.pdf.
Hugo, N. C., & Lacher, R. G. (2014.) Understanding the role of culture and heritage in community festivals: An importance-performance analysis. Journal of Extension 52(5), Article 5RIB4. Retrieved from http://www.joe.org/joe/2014october/rb4.php.
Levenburg, N. M., & Magal, S. R. (2005.) Applying importance-performance analysis to evaluate e-business strategies among small firms. e-Service Journal, 3(3), 29-48. https://doi.org/10.1353/esj.2005.0012
Martilla, J. A., & James, J. C. (1977.) Importance-performance analysis. Journal of Marketing, 10(1), 13-22.
https://doi.org/10.2307/1250495
Siniscalchi, J. M., Beale, E. K., & Fortuna, A. (2008.) Using importance-performance analysis to evaluate training. Performance Improvement, 47(10), 30-35. https://doi.org/10.1002/pfi.20037

