Predictive Identification of At-Risk Students: Using Learning Management System Data
J. Bryan Osborne1* & Andrew S.I.D. Lang2
1College of the Ozarks
2Oral Roberts University
Abstract
This paper describes a neural network model that can be used to detect at-risk students failing a particular course using only grade book data from a learning management system. By analyzing data extracted from the learning management system at the end of week 5, the model can predict with an accuracy of 88% whether the student will pass or fail a specific course. Data from the grade books from all course shells from the Spring 2022 semester (N = 22,041 rows) were analyzed, and four factors were found to be significant predictors of student success/failure: the current course grade after the fifth week of the semester and the presence of missing grades in weeks 3, 4, and 5. Several models were investigated before concluding that a neural network model had the best overall utility for the purpose of an early alert system. By categorizing students who are predicted to fail more than one course as being generally at risk, we provide a metric for those who use early warning systems to target resources to the most at-risk students and intervene before students drop out. Seventy-four percent of the students whom our model classified as being generally at risk ended up failing at least one course.
Keywords: at-risk students, early detection, LMS data, machine learning, student retention, student success
* Contact: bosborne@cofo.edu

© 2023 Osborne & Lang. This open access article is distributed under a Creative Commons Attribution 4.0 License (https://creativecommons.org/licenses/by/4.0/)
Predictive Identification of At-Risk Students: Using Learning Management System Data
Recent attention to graduation rates in higher education has resulted in increased interest in early identification and support for at-risk students. Atif et al. (2020) argue that this is a critical area of focus, as failing to identify and support at-risk students can result in significant financial costs for institutions and lost opportunities for students.
Several models have been developed to identify at-risk students, using data from single courses or the general student body (Gašević et al., 2016). However, many of these models do not account for sociodemographic factors, such as race, gender, residency, or status as a freshman, transfer, adult, or first-generation student, which have been shown to be associated with significant performance gaps (Cano & Leonard, 2019). This gap in the literature is particularly concerning, as these groups may be more vulnerable to dropping out or underperforming.
To address this gap, it is crucial to consider not only data from the general student population but also data that is representative of these historically marginalized groups. By including data specific to these groups, educators can better understand the unique challenges and opportunities that these students face and provide targeted interventions to support them. For example, identifying patterns of underperformance among first-generation students may enable educators to implement strategies that help these students navigate the college experience more effectively.
The main objective of this study is to identify students who are at risk of struggling academically and potentially dropping out of college. In order to achieve this goal, the study presents models that can identify students who are at risk of failing specific courses, as well as students who are generally at risk of stopping out, as indicated by their predicted likelihood of failing more than one course.
The rationale behind these working definitions is that by identifying students who are struggling academically as early as possible, institutions can provide timely support and interventions that may help these students succeed. For example, students who are predicted to fail a specific course could benefit from targeted tutoring or additional study resources, while students who are generally at risk of stopping out may benefit from interventions aimed at improving their overall academic performance, such as academic coaching or mentoring programs.
By identifying these students early on, institutions can not only improve their graduation rates but also enhance the educational experience of their students. Moreover, timely support and interventions can potentially save students time and money, as well as minimize the risk of negative long-term effects on their academic and professional trajectories.
The present study focuses on two key objectives. First, the study aims to develop an open model using machine learning techniques that can accurately predict the likelihood of a student failing a course in which they are currently enrolled, using data from the institution’s learning management system (LMS) from the first five weeks. The model developed will be presented as the best model found by the researchers.
Second, the study aims to identify students who are at risk in general and may potentially drop out of school altogether. This will be achieved by identifying students who are predicted to fail one or more courses in a semester, thus indicating a higher likelihood of dropping out. Such students should be given special attention and provided with both academic and non-academic support interventions to help them succeed. On the other hand, a student who is struggling in a single course may only require targeted academic support to improve their performance.
This study adds to previous research by providing a more comprehensive and timely approach to identifying at-risk students, especially those from traditionally marginalized groups. By focusing on data from the first five weeks of a course, this study provides institutions with the opportunity to intervene and support struggling students earlier. Additionally, this study addresses the need to specifically identify at-risk students from historically marginalized groups, which has not been a focus in previous studies. By presenting an open model, this study offers a framework for other institutions to adapt and implement to improve their own early identification and support systems for at-risk students. This study contributes to the ongoing effort to increase graduation rates and improve outcomes for all students.
Background
When discussing student success in higher education, the term “at-risk” is often used to describe students who may be struggling and are at risk of negative outcomes such as failing, dropping out, stopping out, or burning out (Chibaya et al., 2022). However, at-risk can also refer to students who are not meeting satisfactory academic progress (SAP) requirements. SAP is a standard of academic performance that students must maintain to be eligible for federal financial aid. This standard includes a minimum grade point average (GPA) and completing a certain percentage of courses attempted. SAP was first introduced in 1976 as an amendment to the Higher Education Act of 1965 (Federal Student Aid, 2022).
When building predictive models for students, researchers often use the term at-risk to divide the student population into two groups: those who are at risk and those who are not. In these models, several factors emerge as significant predictors of a student being at risk, including grades (Larose & Tarabulsy, 2014; Russell et al., 2020), preparedness (Casanova et al., 2021; Owen et al., 2021; Russell et al., 2020), student behavior/attitudes (Delmas & Childs, 2021; McManus, 2020; Owen et al., 2021; Russell et al., 2020), academic momentum (Adelman, 1999, 2006), and student academic and social integration (Tinto, 2012).
Accurate predictions of academic performance for individual students are essential to inform interventions. To achieve this goal, researchers have identified several important attributes for predicting student academic performance, such as aspects of a student’s demographic and socioeconomic background (e.g., place of birth, disability, parent academic and job background, residing region, gender, socioeconomic index, health insurance, frequency of going out with friends, financial status; Imran et al., 2019; Jain & Solanki, 2019; Purwoningsih et al., 2019; Rubiano & Garcia, 2016; Shanmugarajeshwari & Lawrance, 2016; Tenpipat & Akkarajitsakul, 2020; Zeineddine et al., 2021), pre-enrollment (e.g., high school or level 12 performance and grades, entrance qualification, SAT scores, English and math grades, awards, school they attended; Iatrellis et al., 2021; Imran et al., 2019; Jain & Solanki, 2019; Rubiano & Garcia, 2016; Tenpipat & Akkarajitsakul, 2020; Xu et al., 2017; Zeineddine et al., 2021), enrollment (e.g., enrollment date, enrollment test marks, number of courses students previously enrolled in, type of study program, study mode; Berens et al., 2019; Kemper et al., 2020), tertiary academic (e.g., attendance, number of assessment submissions, student engagement ratio, major, time left to complete degree, course credits, semester work marks, placements, count and date of attempted exams; Berens et al., 2019; Iatrellis et al., 2021; Imran et al., 2019; Kemper et al., 2020; Xu et al., 2017; Yang & Li, 2018), and LMS-based data.
While student records, such as GPA and semester or final results, have been frequently used as categorical variables to assess a student’s academic potential (Akram et al., 2019; Berens et al., 2019; Iatrellis et al., 2021; Imran et al., 2019; Jain & Solanki, 2019; Kemper et al., 2020; Li et al., 2020; Purwoningsih et al., 2019; Rubiano & Garcia, 2016; Tenpipat & Akkarajitsakul, 2020; Xu et al., 2017; Yang & Li, 2018; Zeineddine et al., 2021), few studies have used LMS-generated data to predict student achievement. LMS data, such as the frequency of interaction of a student with each module on LMS (Nespereira et al., 2015), counts of hits, forum post details, counts of assessments viewed and submitted on LMS (Purwoningsih et al., 2019), start and end dates, and assessment submission dates (Akram et al., 2019), provide complete information about a student’s engagement in online learning sessions and workshops. These data are automatically generated and stored by the LMS, making them cost-effective, accessible, and relatively easy to analyze.
However, few studies have investigated the correlations between LMS attributes, selection of relevant attributes, and tuning of classifier algorithm parameters for accurate prediction of student progress. Furthermore, most studies have focused on traditional face-to-face or online classroom settings (Li et al., 2020), and data sets obtained from blended learning are limited (Nespereira et al., 2015; Purwoningsih et al., 2019). To address these gaps, researchers must focus on early detection of at-risk students to implement remedial measures promptly.
Over the past decade, there has been a significant increase in the development of correlation and predictive analytics models that rely on data mining of student data to identify at-risk students. These models have been developed by researchers in various fields, including education, computer science, and data analytics, and have shown promising results in identifying students who may be struggling academically.
Some of the most notable studies in this area include those conducted by Akçapınar et al. (2019), Baron et al. (2022), Cardona et al. (2020), Essa & Ayad (2012), Gašević et al. (2016), Marbouti et al. (2016), Papamitsiou & Economides (2014), Trivedi (2022), and Wolff et al. (2013). These studies have demonstrated that by analyzing various student data points, such as grades, attendance records, and participation in extracurricular activities, it is possible to identify students who may be at risk of academic failure.
One of the key benefits of these models is that they enable educators to identify at-risk students at an early stage. This is crucial because research has shown that the earlier a student is identified as being at risk, the more likely it is that intervention strategies will be effective. For instance, several studies (Danilowicz-Gösele et al., 2017; Dweck et al., 2014; Gašević et al., 2016; Jayaprakash et al., 2014; Singell & Waddell, 2010) have shown that early intervention can help prevent academic failure and improve student outcomes.
Machine learning is the intersection between the fields of computer science and statistics (Jordan & Mitchell, 2015). Statistical methods can generate probabilities and provide statistically significant inferencing on data sets. However, as the size of the data being studied increases, the human capital required to perform such calculations quickly becomes out of reach. Computers provide the ability to rapidly and repeatedly execute calculations, allowing statistical analyses that could not humanly be performed to be calculated in minutes. A variety of machine learning models are available for use in performing analyses, and several more common and reliable models were chosen for comparison in this study, namely logistic regression, k-nearest neighbor (kNN), random forest, and a neural network (Cardona et al., 2020).
Logistic regression is a widely used technique in producing predictions for classification problems. It involves using the linear regression technique with a sigmoid function to convert the probabilistic outcome to a binary classifier, such as predicting whether a student will pass or fail a course.
Another popular classification model is kNN, which calculates the distance, usually Euclidian, of each new observation as it is added and identifies its “k” nearest neighbors. The classification of the majority of the nearest neighbors is then assigned to the new input. Taunk et al. (2019) explain that kNN models are particularly useful when there are many features but only a few are relevant to the classification task.
Random forest models, on the other hand, generate classifications through a majority voting process of a large number of decision trees. The individual decision trees are constructed using a random selection of the independent variables, as well as a sampling with replacement of observations. This approach provides a powerful way to handle high-dimensional data and is capable of capturing complex interactions between variables. Breiman (2001) suggests that the strength of random forest models is their ability to handle large data sets with high dimensionality.
Finally, a single-layer, feed-forward neural network is a model inspired by the human brain. It uses a set of interconnected nodes that resemble the neurons in the human brain to generate predicted values. The input layer of the model comprises the independent variables being used in the problem, which are weighted and transmitted to nodes in the hidden layer. Each node in the hidden layer receives input from each input node, and values are summed and processed by an activation function, often a sigmoid function like that used in logistic regression. In this single-layer neural network, outputs from the hidden layer nodes are collected by the output layer, which classifies the observation. Abiodun et al. (2018) note that neural network models are particularly useful when the relationships between the input variables and the output variable are complex and nonlinear.
Methods
To achieve the goal of identifying students likely to fail a course, this study was framed as a binary classification problem. Therefore, the output of the model needed to label a student as either at risk of failing or not at risk of failing based on available grade information after the fifth week of classes. The specific features of interest were the student’s weekly grade, representing their current standing in the course, and if the student had a history of missing grades/assignments.
The general approach taken in this research effort is reflective of the Open Academic Analytics Initiative (OAAI) predictive modeling architecture outlined by Jayaprakash et al. (2014). This involved performing traditional extract-transform-load (ETL) processing from the LMS to gather and prepare the data prior to inputting it into the machine learning algorithms. The ETL process retrieves data from the LMS and performs a series of programmatic actions to clean the data, manage missing values, convert data types, and derive features. Certain features were transformed post-extraction but prior to model training to provide greater flexibility in the analysis and modeling processes.
Grade information for the Spring 2022 semester was extracted from the university’s LMS, D2L Brightspace, and the Banner Enterprise Resource Planning (ERP) database, used by the Registrar to hold student records. The raw data extracted from the systems were composed of weekly data pulls reflecting students’ weekly standing in a course, as well as data containing students’ final semester grades. Files were provided in the form of Excel spreadsheets and comma-separated values.
Data transformation was performed using Python applications and a MySQL database. Weekly grade data were cleaned, parsed, transformed, and then stored in database tables along with final course grades present in the Banner ERP extract. Following this initial load, the data were analyzed to see if weekly grades were missing for certain assignments for each student in a course—once grades began to appear in the course. If a weekly grade was missing, a determination needed to be made as to a potential cause. For example, the absence of a grade in the LMS could be due to a student’s failure to submit an assignment in a timely manner, because there were no assignments due, or because the instructor had not graded any assignments that week. The data were scanned to determine the existence of grades for each course for each week. If grades were present, a separate database record was created to signify the existence of grades that week as well as the percentage of students who had received a grade. If a specified percentage of students had a weekly grade present in the course that week, students without grades were flagged as having missed work that week. This value is referred to as the missed grade threshold (MGT). If no grades had been entered or the percentage of students with a grade was less than the specified percentage, the student’s grade from the previous week was carried forward and used as the current week’s grade. Initially, an MGT value of 80% was selected for model comparison, and later values of 67, 75, 80, and 90% were used to check for differences in model performance.
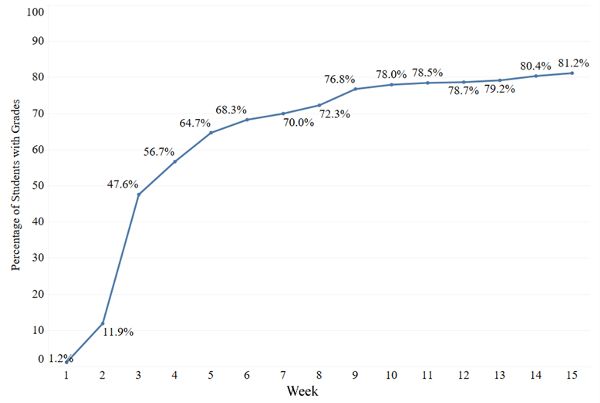
With this level of cleaning and transformation complete, an extract from the MySQL database was taken to be used in modeling. The extract file contained records representing each student in each course, with columns containing weekly grades, flags indicating missing assignments for a given week, and the student’s final course grades, if present in the extracts. The data contained in this extract file were further analyzed and processed using R scripts. Given that the final course grade was used as the dependent variable, only observations with final grades consisting of a traditional A-F grade value, passing (P)/not passing (NP), incomplete (I), and withdrawal (W) were retained, and records with other final semester grade values were dropped from the data set. Students whose final grade was either a D, F, NP, I, or W were labeled with a “0” to denote an at-risk student, and those with grades of A, B, C, or P were labeled with a “1.” Since early detection of at-risk students was the goal, independent variables were the current course grade after the fifth week of the semester and the presence of missing grades in weeks 3, 4, and 5. We found that the data were too sparse before week 5 to have significant, meaningful information (see Figure 1).
Several supervised machine learning model approaches were utilized to construct models, and the resulting output of each was reviewed for the best performance. Approaches included logistic regression, random forest, kNN, and a single-layer neural network. RStudio was utilized as an Integrated Development Environment (IDE), and code was constructed primarily using TidyVerse (Wickham et al., 2019) and TidyModels (Kuhn & Wickham, 2020). The extract file was separated into training and testing data sets using a 70/30 split and the final course grade as a stratified sampling variable.
After training each of the models mentioned, predictions were created with the model using the testing data set. Students predicted to be at risk were labeled with a “0,” and those predicted as not at risk were labeled with a “1.” Confusion matrices and receiver operating characteristic curves were created, as were a metric set for each model to evaluate the accuracy, sensitivity, specificity, and precision. Furthermore, 10-fold cross-validation was performed using the same metrics to help ensure that the models were generalizable.
Figure 1. Percentage of Students Who Received a Final Grade at the End of the Semester With Grades in D2L Brightspace by Week
Each model was executed against the same training and testing data sets for each fold, and model performance statistics were gathered. The models were tuned based on model performance metrics, and additional runs were made before a final run was performed. In each case, the tuned models performed better than the untuned version. Finally, the tuned models trained using LMS grade book data from Spring 2022 were compared by additionally testing their performance on LMS grade book data from Fall 2021.
Limitations
One limitation of the study is that the data analyzed was collected from a single semester and was not randomized. This means that the findings may not be generalizable to other semesters or institutions. For example, the study may not have captured the impact of seasonal factors on student performance, such as the effects of weather or holidays on attendance and motivation. Additionally, the lack of randomization means that the sample may not be representative of the broader student population at the university, which may limit the generalizability of the findings.
Another limitation of the study is the lack of prespecified subgroups, which may limit the ability to draw specific conclusions about certain student populations. For example, the study did not investigate whether there were differences in the factors that contribute to success or failure between students from different majors or with different academic backgrounds. This limitation may limit the applicability of the findings to specific student groups and may make it difficult to design targeted interventions that are tailored to the needs of different student populations.
Another limitation is the variability in the use of LMS grade books across courses and disciplines, which may affect the accuracy and completeness of the data. For example, some instructors may use the LMS grade book more extensively than others, which may result in differences in the amount and quality of data available for analysis. This variability may limit the ability to make meaningful comparisons across different courses and may make it difficult to draw conclusions about the effectiveness of specific interventions.
This study also does not account for other potential factors that may impact student success, such as mental health, socioeconomic status, or family obligations. For example, a student’s mental health status or financial situation may impact their ability to succeed in a course, even if they have a strong academic record. This limitation may limit the accuracy and completeness of the predictive model and may make it difficult to design effective interventions that address the root causes of student attrition.
Finally, it should be noted that the study excludes institutional policies, which may also be factors that contribute to students not being able to complete college in a timely manner, from institutional financial aid and transfer policies (Baum & Scott-Clayton, 2013; Monaghan & Attewell, 2015) to limited course availability and scheduling issues (Abele, 2021). Despite these limitations, this study provides a valuable foundation for future research and interventions aimed at improving graduation rates by identifying at-risk students early and providing targeted support.
Results
The first step in the research effort was to determine the model to utilize in the identification of students at risk of failing a course. Four models were developed and compared: logistic regression, random forest, kNN, and neural network. The Generalized Linear Model (GLM) logistic regression model output indicated that missing grades in the third week were not statistically significant (p > .05); as such, the variable was dropped, and the model was retrained. The final logistic model showed that the grade at week 5 (W05) and missing work in weeks 4 and 5 were all statistically significant (p < .05). The ‘Ranger’ random forest model implementation (Breiman, 2001) was trained and initial metrics were captured, followed by tuning the model across a 10-fold grid with the number of trees (100–1000) and a minimum number of nodes (5–50) as hyperparameters. The tuning of the hyperparameters indicated that a tree count of 300 and minimum node size of 50 was preferred using accuracy and receiver operating characteristic (ROC) curve/area under the curve (AUC) as metrics. The initial kNN model run used a nearest neighbor k-value of 5 and offered relatively poor results. Tuning on a grid of 10 k-values from 100 to 1000 resulted in k = 400, providing the best predictive results. Finally, the NNet model (Venables & Ripley, 2002, Chapter 7) was evaluated as a feed-forward neural network with a single hidden layer. The default model generated a 4-5-1 network with 31 weights and 100 epochs. The tuning process utilized a 6-level grid of epochs (50–200) and hidden units (3–24) and suggested a 4-15-1 network with 91 weights and 50 epochs.
Several relevant metrics were calculated for each of the models, including accuracy, sensitivity, precision, and specificity. Accuracy provides a ratio of all correctly predicted values to the total number of predicted values. Sensitivity, often referred to as the true positive rate, is the ratio of students predicted to fail a course to the number that actually failed. Specificity, commonly referred to as the true negative rate, reflects the ratio of students predicted to pass a course to the number who actually passed. ROC/AUC calculations provide a suitable means of evaluating model accuracy (Bowers & Zhou, 2019). The ROC/AUC values represent the area under the curve of the models’ receiver operating characteristic curves. The ROC curve provides an evaluation of model performance at all thresholds, and a higher AUC value signifies an increased ability of a model to better distinguish between passing and failing students.
Accuracy, sensitivity, precision, specificity, and ROC/AUC values were computed for the GLM logistic, random forest, kNN nearest neighbor, and the NNet neural net model (see Table 1). Values derived from 10-fold cross-validation indicated that the models shared very similar metrics, especially in terms of overall accuracy, with all four models having an accuracy score of 88%. Except for the GLM, the ROC/AUC scores were close to 81% for all models. The models were 97% correct in predicting students passing courses (specificity). The neural net model scored highest in sensitivity, with a 26.6% correct prediction rate of students failing courses (sensitivity).
Given that the research’s purpose was to explore a model’s ability to identify at-risk students, sensitivity values were of particular interest. The logistic regression and neural net models scored highest with correct predictions, 25.4% and 26.6% of the time, respectively, in terms of students who would fail in a specific course.
Table 1. Model Metrics for Models Compared in the Study Using 10-fold Cross-Validation and Spring 2022 Data
|
Model |
Accuracy |
Sensitivity |
Precision |
Specificity |
ROC/AUC |
|---|---|---|---|---|---|
|
GLM |
0.878 |
0.254 |
0.612 |
0.975 |
0.794 |
|
Random forest |
0.876 |
0.235 |
0.605 |
0.976 |
0.809 |
|
kNN |
0.877 |
0.212 |
0.622 |
0.980 |
0.806 |
|
NNet |
0.877 |
0.266 |
0.601 |
0.973 |
0.808 |
Note. ROC = receiver operating characteristic; AUC = area under the curve. Please refer to article text for information on models presented.
Although the GLM bested NNet in precision, the NNet model scored higher on ROC/AUC. As the GLM and NNet models produced the greatest number of true positives on the test data set, these two models were tested further. Data were pulled from the Fall 2021 semester, and the models were run using it for additional testing. A 10-fold cross-validation was performed, and the accuracy of the models was consistent with the initial results. The NNet model performed better in sensitivity, precision, and ROC/AUC, and the GLM scored higher in specificity. The metrics used for comparison are provided in Table 2.
Table 2. Comparison of Model Metrics Using Fall 2021 Test Data
|
Model |
Accuracy |
Sensitivity |
Specificity |
Precision |
ROC/AUC |
|---|---|---|---|---|---|
|
GLM |
0.862 |
0.200 |
0.964 |
0.457 |
0.773 |
|
NNet |
0.862 |
0.224 |
0.960 |
0.463 |
0.783 |
Note. ROC = receiver operating characteristic; AUC = area under the curve. Please refer to article text for information on models presented.
An evaluation of the effect that changes in the MGT had in the models indicated that as the threshold increased, the accuracy, precision, and specificity increased with both the GLM and NNet models. Again, 10-fold cross-validation was utilized to prevent possible data-split bias. The evaluation found that sensitivity, a measure of particular interest in this effort, decreased as MGT increased in the GLM but increased to a maximum value at 80% MGT and then decreased at 90%. The ROC/AUC values peaked in both models’ 75% and 80% MGT ranges, reflecting the rapid drop in sensitivity despite increasing specificity. These values are presented in Table 3.
Table 3. MGT Effects on GLM and NNet Model Metrics Using k-fold Cross-Validation
|
GLM |
MGT |
Accuracy |
Sensitivity |
Precision |
Specificity |
ROC/AUC |
|---|---|---|---|---|---|---|
|
67 |
0.868 |
0.277 |
0.54 |
0.962 |
0.789 |
|
|
75 |
0.874 |
0.267 |
0.582 |
0.969 |
0.792 |
|
|
80 |
0.878 |
0.254 |
0.612 |
0.975 |
0.794 |
|
|
90 |
0.883 |
0.214 |
0.614 |
0.98 |
0.785 |
|
|
NNet |
Accuracy |
Sensitivity |
Precision |
Specificity |
ROC/AUC |
|
|
67 |
0.869 |
0.246 |
0.56 |
0.969 |
0.805 |
|
|
75 |
0.872 |
0.257 |
0.574 |
0.97 |
0.809 |
|
|
80 |
0.877 |
0.265 |
0.601 |
0.973 |
0.808 |
|
|
90 |
0.882 |
0.200 |
0.629 |
0.982 |
0.793 |
Finally, N = 618 students in the Fall 2021 data set were identified as being at risk of failing at least one class. Of these, N = 171 students were identified as being generally at risk (students predicted to fail at least two courses). Seventy-four percent of these generally at-risk students ended up failing at least one class.
Discussion
The ability to detect at-risk students as early as possible—earlier than the once-traditional benchmark of mid-term grades—is crucial. It allows institutions to construct effective, proactive, and holistic intervention strategies to improve student success and retention.
We have demonstrated that it is possible to create a neural net-based model using easily attainable data from a widely used LMS system that can identify at-risk students—students who are predicted to fail at least one course—with reasonable accuracy as early as week 5. Our model performs as well as, and in some cases better than, other recently published models (Akçapınar et al., 2019; Baron et al., 2022; Cardona et al., 2020; Essa & Ayad, 2012; Gašević et al., 2016; Marbouti et al., 2016; Papamitsiou & Economides, 2014; Trivedi, 2022; Wolff et al., 2013) and by using, in most cases, less and more easily accessible data, is novel in its use of incorporating a simple missing grade flag indicating missed work for weeks 3, 4, and 5.
Detecting students at risk of failing a course earlier than week 5 proved difficult due to the lack of grade data available before week 5 (see Figure 1). We note that the dearth of early grade data before week 5 only reinforces the need to encourage faculty to follow the best practices of providing students with early low-stakes assessments and timely feedback (Brown et al., 2014). The week 5 mark does not seem unique to our institution, as week 5 is the suggested time for early detection in other works (Akçapınar et al., 2019; Cardona et al., 2020; Marbouti et al., 2016).
The identification of generally at-risk students by flagging students who are predicted to fail more than one course allows for focused non-academic intervention strategies to be carried out. The significance of the measure is evident, as 74% (N = 126) of students who were flagged as being generally at risk ended up failing at least one course.
Having two groups of at-risk students—students who have difficulty in only one course and students who have difficulty in multiple courses—allows for just-in-time academic support (tutoring, peer support, etc.) tailored individually for the former and more holistic intervention strategies that focus on the psychosocial well-being of students (success coach mentoring, one-on-one counseling, etc.) for the latter.
Future developments to refine the models discussed in this article could include, among other things, the addition of socioeconomic and demographic factors such as race, gender, residency, or status as a freshman, transfer, adult, or first-generation student to help identify at-risk students that have traditionally been identified as having more significant performance gaps.
Conclusion
The issue of identifying at-risk students in higher education is a major concern for all stakeholders, and it is likely to remain so for the foreseeable future. To help address this challenge, we have developed several models that can be used to identify students who are at risk of failing a course with an impressive 80% accuracy. These models rely on data that is readily available from a standard LMS system, making them easy to implement in most educational settings.
Specifically, our evaluations have shown that the most effective way to identify at-risk students is to use D2L Brightspace course grade data at week 5. By using a neural net model with a 4-15-1 network and 91 weights, and training it over 50 epochs, we were able to achieve an accuracy of 0.877, sensitivity of 0.265, precision of 0.601, specificity of 0.973, and ROC of 0.808. This model uses parameters that represent the student’s current standing in the course at week 5, as well as any missing grades or assignments flagged at weeks 3, 4, and 5, with an MGT threshold of 80%.
Importantly, we found that our generally at risk measure is also highly useful for identifying students who are likely to struggle in multiple courses. Our analysis revealed that 74% of students who were predicted to fail more than one course actually ended up failing at least one course. This highlights the potential of our approach to identify at-risk students early on, which can facilitate early intervention and increase the likelihood of student success and retention.
Overall, our findings suggest that our models and methods can help educators identify at-risk students in higher education with a high degree of accuracy and precision. By using these tools to detect students who may be struggling early on, educators can take proactive steps to provide targeted support and resources to help those students succeed. This could have significant benefits for both the students and the institutions they attend, ultimately contributing to better outcomes for everyone involved.
Author Note: We have no conflict of interest to disclose.
References
Abele, L. (2021). Institutional barriers contribute to low college completion rates. Journal of Postsecondary Student Success, 1(1), 18–24. https://doi.org/10.33009/fsop_jpss124555
Abiodun, O. I., Jantan, A., Omolara, A. E., Dada, K. V., Mohamed, N. A., & Arshad, H. (2018). State-of-the-art in artificial neural network applications: A survey. Heliyon, 4(11), Article e00938. https://doi.org/10.1016/j.heliyon.2018.e00938
Adelman, C. (1999). Answers in the tool box: Academic intensity, attendance patterns, and bachelor’s degree attainment. U.S. Department of Education, Office of Educational Research and Improvement.
Adelman, C. (2006). The toolbox revisited: Paths to degree completion from high school through college. U.S. Department of Education.
Akçapınar, G., Hasnine, M. N., Majumdar, R., Flanagan, B., & Ogata, H. (2019). Developing an early-warning system for spotting at-risk students by using ebook interaction logs. Smart Learning Environments, 6(1), Article 4. https://doi.org/10.1186/s40561-019-0083-4
Akram, A., Fu, C., Li, Y., Javed, M. Y., Lin, R., Jiang, Y., & Tang, Y. (2019). Predicting students’ academic procrastination in blended learning course using homework submission data. IEEE Access, 7, 102487–102498. https://doi.org/10.1109/ACCESS.2019.2930867
Atif, A., Richards, D., Liu, D., & Bilgin, A. A. (2020). Perceived benefits and barriers of a prototype early alert system to detect engagement and support ‘at-risk’ students: The teacher perspective. Computers & Education, 156, Article 103954. https://doi.org/10.1016/j.compedu.2020.103954
Baron, M. J. S., Sanabria, J. S. G., & Diaz, J. E. E. (2022). Deep neural network DNN applied to the analysis of student dropout. Investigación e Innovación en Ingenierías, 10(1), 202–214. https://doi.org/10.17081/invinno.10.1.5607
Baum, S., & Scott-Clayton, J. (2013). Redesigning the Pell Grant program for the twenty-first century. The Hamilton Project.
Berens, J., Schneider, K., Gortz, S., Oster, S., & Burghoff, J. (2019). Early detection of students at risk—Predicting student dropouts using administrative student data from German universities and machine learning methods. Journal of Educational Data Mining, 11(3), 1–41. https://doi.org/10.5281/zenodo.3594771
Bowers, A. J., & Zhou, X. (2019). Receiver operating characteristic (ROC) area under the curve (AUC): A diagnostic measure for evaluating the accuracy of predictors of education outcomes. Journal of Education for Students Placed at Risk, 24(1), 20–46. https://doi.org/10.1080/10824669.2018.1523734
Breiman, L. (2001). Random forests. Machine Learning, 45, 5–32. https://doi.org/10.1023/A:1010933404324
Brown, P. C., Roediger III, H. L., & McDaniel, M. A. (2014). Make it stick: The science of successful learning. Harvard University Press. https://doi.org/10.4159/9780674419377-008
Cano, A., & Leonard, J. D. (2019). Interpretable multiview early warning system adapted to underrepresented student populations. IEEE Transactions on Learning Technologies, 12(2), 198–211. https://doi.org/10.1109/tlt.2019.2911079
Cardona, T., Cudney, E. A., Hoerl, R., & Snyder, J. (2020). Data mining and machine learning retention models in higher education. Journal of College Student Retention: Research, Theory & Practice. Advance online publication. https://doi.org/10.1177/1521025120964920
Casanova, J. R., Gomes, C. M. A., Bernardo, A. B., Núnez, J. C., & Almeida, L. S. (2021). Dimensionality and reliability of a screening instrument for students at-risk of dropping out from higher education. Studies in Educational Evaluation, 68, Article 100957. https://doi.org/10.1016/j.stueduc.2020.100957
Chibaya, C., Whata, A., & Madzima, K. (2022). A scoping review of the “at-risk” student literature in higher education. bioRxiv. https://doi.org/10.1101/2022.07.06.499019
Danilowicz-Gösele, K., Lerche, K., Meya, J., & Schwager, R. (2017). Determinants of students’ success at university. Education Economics, 25(5), 513–532. https://doi.org/10.1080/09645292.2017.1305329
Delmas, P. M., & Childs, T. N. (2021). Increasing faculty engagement in the early alert process. Innovations in Education and Teaching International, 58(3), 283–293. https://doi.org/10.1080/14703297.2020.1740102
Dweck, C. S., Walton, G. M., & Cohen, G. L. (2014). Academic tenacity: Mindsets and skills that promote long-term learning. Bill & Melinda Gates Foundation.
Essa, A., & Ayad, H. (2012). Improving student success using predictive models and data visualizations. Research in Learning Technology, 20(sup1), Article 19191. https://doi.org/10.3402/rlt.v20i0.19191
Federal Student Aid. (2022). Staying eligible. https://studentaid.gov/understand-aid/eligibility/staying-eligible
Gašević, D., Dawson, S., Rogers, T., & Gasevic, D. (2016). Learning analytics should not promote one size fits all: The effects of instructional conditions in predicting academic success. The Internet and Higher Education, 28, 68–84. https://doi.org/10.1016/j.iheduc.2015.10.002
Iatrellis, O., Savvas, I. Κ., Fitsilis, P., & Gerogiannis, V. C. (2021). A two-phase machine learning approach for predicting student outcomes. Education and Information Technologies, 26, 69–88. https://doi.org/10.1007/s10639-020-10260-x
Imran, M., Latif, S., Mehmood, D., & Shah, M. S. (2019). Student academic performance prediction using supervised learning techniques. International Journal of Emerging Technologies in Learning, 14(14), 92–104. https://doi.org/10.3991/ijet.v14i14.10310
Jain, A. C., & Solanki, S. (2019). An efficient approach for multiclass student performance prediction based upon machine learning. 2019 International Conference on Communication and Electronics Systems, 1457–1462. https://doi.org/10.1109/ICCES45898.2019.9002038
Jayaprakash, S. M., Moody, E. W., Lauría, E. J. M., Regan, J. R., & Baron, J. D. (2014). Early alert of academically at-risk students: An open source analytics initiative. Journal of Learning Analytics, 1(1), 6–47. https://doi.org/10.18608/jla.2014.11.3
Jordan, M. I., & Mitchell, T. M. (2015). Machine learning: Trends, perspectives, and prospects. Science, 349(6245), 255–260. https://doi.org/10.1126/science.aaa8415
Kemper, L., Vorhoff, G., & Wigger, B.U. (2020). Predicting student dropout: A machine learning approach. European Journal of Higher Education, 10(1), 28–47. https://doi.org/10.1080/21568235.2020.1718520
Kuhn, M., & Wickham, H. (2020). Tidymodels: a collection of packages for modeling and machine learning using tidyverse principles. [Review of Tidymodels: a collection of packages for modeling and machine learning using tidyverse principles.]. https://www.tidymodels.org
Larose, S., & Tarabulsy, G. M. (2014). Academically at-risk students. In D. L. DuBois & M. J. Karcher (Eds.), Handbook of youth mentoring (2nd ed., pp. 303–314). Sage Publications.
Li, H., Ding, W., Yang, S., & Liu, Z. (2020). Identifying at-risk K-12 students in multimodal online environments: A machine learning approach. ArXiv, abs/2003.09670. https://doi.org/10.48550/arXiv.2003.09670
Lu, O. H. T., Huang, A. Y. Q., & Yang, S. J. H. (2021). Impact of teachers’ grading policy on the identification of at-risk students in learning analytics. Computers & Education, 163, Article 104019. https://doi.org/10.1016/j.compedu.2020.104109
Marbouti, F., Diefes-Dux, H. A., & Madhavan, K. (2016). Models for early prediction of at-risk students in a course using standards-based grading. Computers & Education, 103, 1–15. https://doi.org/10.1016/j.compedu.2016.09.005
McManus, E. M. (2020). Reducing school dropout rates through early identification of students at risk. Emerging Perspectives: Interdisciplinary Graduate Research in Education and Psychology, 4(2), 67–78.
Monaghan, D. B., & Attewell, P. (2015). The community college route to the bachelor’s degree. Educational Evaluation and Policy Analysis, 37(1), 70–91. https://doi.org/10.3102/0162373714521865
Nespereira, C. G., Elhariri, E., El-Bendary, N., Vilas, A. F., & Redondo, R. P. (2015). Machine learning based classification approach for predicting students performance in blended learning. International Conference on Advanced Intelligent System and Informatics, 47–56. https://doi.org/10.1007/978-3-319-26690-9_5
Papamitsiou, Z., & Economides, A. A. (2014). Learning analytics and educational data mining in practice: A systematic literature review of empirical evidence. Journal of Educational Technology & Society, 17(4), 49–64.
Purwoningsih, T., Santoso, H. B., & Hasibuan, Z. A. (2019). Online learners’ behaviors detection using exploratory data analysis and machine learning approach. International Conference on Informatics and Computing, 1–8. https://doi.org/10.1109/ICIC47613.2019.8985918
Rubiano, S. M. M., & Garcia, J. A. D. (2016). Analysis of data mining techniques for constructing a predictive model for academic performance. IEEE Latin America Transactions, 14(6), 2783–2788. https://doi.org/10.1109/TLA.2016.7555255
Russell, J., Smith, A., & Larsen, R. (2020). Elements of success: Supporting at-risk student resilience through learning analytics. Computers & Education, 152, Article 103890.
Shanmugarajeshwari, V., & Lawrance, R. (2016). Analysis of students’ performance evaluation using classification techniques. 2016 International Conference on Computing Technologies and Intelligent Data Engineering, 1–7. https://doi.org/10.1109/ICCTIDE.2016.7725375
Singell, L. D., & Waddell, G. R. (2010). Modeling retention at a large public university: Can at-risk students be identified early enough to treat? Research in Higher Education, 51(6), 546–572. https://doi.org/10.1007/s11162-010-9170-7
Taunk, K., De, S., Verma, S., & Swetapadma, A. (2019). A brief review of nearest neighbor algorithm for learning and classification. 2019 International Conference on Intelligent Computing and Control Systems, 1255–1260. https://doi.org/10.1109/ICCS45141.2019.9065747
Tenpipat, W., & Akkarajitsakul, K. (2020). Student dropout prediction: A KMUTT case study. 2020 1st International Conference on Big Data Analytics and Practices, 1–5. https://doi.org/10.1109/IBDAP50342.2020.9245457
Tinto, V. (2012). Leaving college: Rethinking the causes and cures of student attrition. University of Chicago Press.
Trivedi, S. (2022). Improving students’ retention using machine learning: Impacts and implications. ScienceOpen Prepints. https://doi.org/10.14293/s2199-1006.1.sor-.ppzmb0b.v1
Venables, W. R., & Ripley, B. D. (2002). Modern applied statistics with S. Springer. https://doi.org/10.1007/978-0-387-21706-2
Wickham, H., Averick, M., Bryan, J., Chang, W., McGowan, L., François, R., Grolemund, G., Hayes, A., Henry, L., Hester, J., Kuhn, M., Pedersen, T., Miller, E., Bache, S., Müller, K., Ooms, J., Robinson, D., Seidel, D., Spinu, V., & Takahashi, K. (2019). Welcome to the Tidyverse. The Journal of Open Source Software, 4(43), 1686. https://doi.org/10.21105/joss.01686
Wolff, A., Zdrahal, Z., Nikolov, A., & Pantucek, M. (2013). Improving retention. Proceedings of the Third International Conference on Learning Analytics and Knowledge—LAK ‘13, 145–149. https://doi.org/10.1145/2460296.2460324
Xu, J., Moon, K. H., & Schaar, M. V. (2017). A machine learning approach for tracking and predicting student performance in degree programs. IEEE Journal of Selected Topics in Signal Processing, 11, 742–753. https://doi.org/10.1109/jstsp.2017.2692560
Yang, F., & Li, F. W. (2018). Study on student performance estimation, student progress analysis, and student potential prediction based on data mining. Computers & Education, 123, 97–108. https://doi.org/10.1016/j.compedu.2018.04.006
Zeineddine, H., Braendle, U. C., & Farah, A. (2021). Enhancing prediction of student success: Automated machine learning approach. Computers & Electrical Engineering, 89, Article 106903. https://doi.org/10.1016/j.compeleceng.2020.106903