The Learner Care Dashboard: An Innovation in Student Support
Samuel Karpen*, Bernadette Howlett, Amy King-Robertson, & Jennie Sanders
Western Governors University
Abstract
Decades of research suggests that supportive faculty communication improves student retention and progression; however, most communication interventions occurred at on-site universities and were implemented briefly in one or several courses. In this article, we describe the outcomes of a consistent, personalized student outreach program implemented in every course and for students’ entire tenure at a fully online university. In 2019, Western Governors University launched a student support program called Learner-Centered Faculty (LCF)—a paradigm that focuses on just-in-time, personalized, student-centered faculty support at scale. We evaluated the impact of LCF on student retention and course completion rates and found that LCF-based intervention improved retention and course completion generally and was particularly beneficial for certain groups of students. In the future, we will examine the mechanisms underlying LCF’s success.
Keywords: student outreach, student communication, retention
* Contact: samuel.karpen@wgu.edu

© 2023 Karpen et al. This open access article is distributed under a Creative Commons Attribution 4.0 License (https://creativecommons.org/licenses/by/4.0/)
The Learner Care Dashboard: An Innovation in Student Support
Despite postsecondary education’s social and economic benefits (Baum, 2014; Carnevale et al., 2022; Mirowsky & Ross, 1998), students sometime progress slowly or leave college altogether (National Center for Education Statistics, 2022a), particularly online students who drop out 10%–20% more often than their in-person counterparts (Bawa, 2016; Herbert, 2006). While there are many remedies for attrition and delayed progression, decades of research suggests that personalized faculty outreach improves student experience and outcomes both in person (Cole & Griffin, 2013; Endo & Harpel, 1982; Lamport, 1993; Pascarella & Terenzini, 1978; Thompson, 2001; Tinto, 1975) and online (LaPadula, 2003; Richardson et al., 2015; Sher, 2009). Most of this research, however, describes interventions that occur in one course, one degree, or for a limited time. Western Governors University (WGU) has created a student outreach program that occurs in all courses for students’ entire enrollment. We describe WGU’s novel program and provide preliminary evidence of its effectiveness.
Review of Literature on Online Student-Faculty Interaction
Tinto (1975) argued that faculty outreach decreased students’ likelihood of dropping out by increasing their sense of belonging. Building on Tinto’s work, Pascarella and Terenzini (1978) reported a significant relationship between student-faculty interaction and academic performance, self-perceived intellectual growth, and self-perceived personal growth even after controlling for pre-admissions variables like GPA, standardized test scores, personality inventories, and college expectations. Similarly, Pascarella and Terenzini’s (1980) review of the college student attrition literature suggested reliable relationships between amount of student-faculty contact and academic performance, attitudes toward college, and attrition, even after controlling for relevant pre-admission variables. More recently, Shelton (2003) found that students who left their Bachelor of Science in Nursing program reported lower Perceived Faculty Support Scale (developed by Shelton, 2003) scores than those who remained. Similarly, Roberts and Styron (2010) found that students who left after their freshman year reported less social connection and less satisfaction with faculty approachability than did students who returned. These benefits extend beyond the freshman year, as Graunke and Woosley (2005) found that outreach was positively related to both GPA and student satisfaction among sophomores. Together, these findings demonstrate a reliable link between faculty outreach and students’ experience and outcomes.
Consequently, interventions that promote student-faculty interaction have usually improved—or at least rarely degraded—student satisfaction, performance, and persistence. Mentorship programs have often been effective (Hamilton et al., 2019; Law & Busenbark, 2020), particularly for underserved students (Dayton et al., 2004; Fries-Britt & Turner, 2002). For example, Hamilton et al. (2019) conducted interviews with students who had recently participated in a mentorship program and found that many reported increased feelings of support and community. Sandner (2015) compared exam failure rates at the beginning and end of a semester both for students who participated in a mentoring program and students who did not and found that mentoring predicted a 15.4% decrease in exam failure rates. Formalized feedback programs have also shown promise (Hattie & Timperley, 2007). Constructive feedback was positively correlated with both grades (Plakht et al., 2013) and confidence (Weaver, 2006). Regardless of the form it takes, personalized faculty outreach seems to promote student success and satisfaction.
While online outreach requires modifications, its benefits seem to hold. For example, Huett et al. (2008) found that students in an online introduction to computer science course who received motivational emails throughout the semester rated their confidence, satisfaction, motivation, and attention in the course higher than those who did not receive motivational emails. Simpson (2008) also found that motivational telephone calls improved student retention by 5% alone and by 25% in conjunction with motivational emails and letters. Discussion boards and online small group discussions have also improved students’ educational experience and encouraged belonging (Rovai, 2001), as have taped or live faculty introductions (Shackelford & Maxwell, 2012). Similarly, Rabe-Hemp et al. (2009) found high levels of dissatisfaction among students who received relatively little faculty contact.
Whether in person or online, personalized faculty outreach often benefits students. Most research, however, focuses more on students’ subjective experience than on objective outcomes. Furthermore, interventions and outcomes are often limited to one year, one course, or one major. Relatively little research exists on the impact of long-term outreach programs implemented across all courses on objective outcomes like retention or course completion. One reason for this absence is that few such programs exist; WGU, however, has implemented such a program.
The Learner-Centered Faculty Model and Related Tools
In 2019, WGU launched a student support program called Learner-Centered Faculty (LCF). The program contains several initiatives; however, this paper focuses on its student support component. As part of LCF, WGU created a faculty tool called the Learner Care Dashboard (LCD) which notifies faculty when students have completed—or failed to complete—activities that could affect their performance or progression. These activities, called Essential Actions (EAs), include but are not limited to:
- • new student assigned to faculty member
- • student needs to set term registration
- • 7 days prior to course start the student has not yet clicked the button to open the course
- • assessment attempts
- • assessment passage/failure
- • multiple days without academic activity in WGU systems or faculty interaction
- • course completion
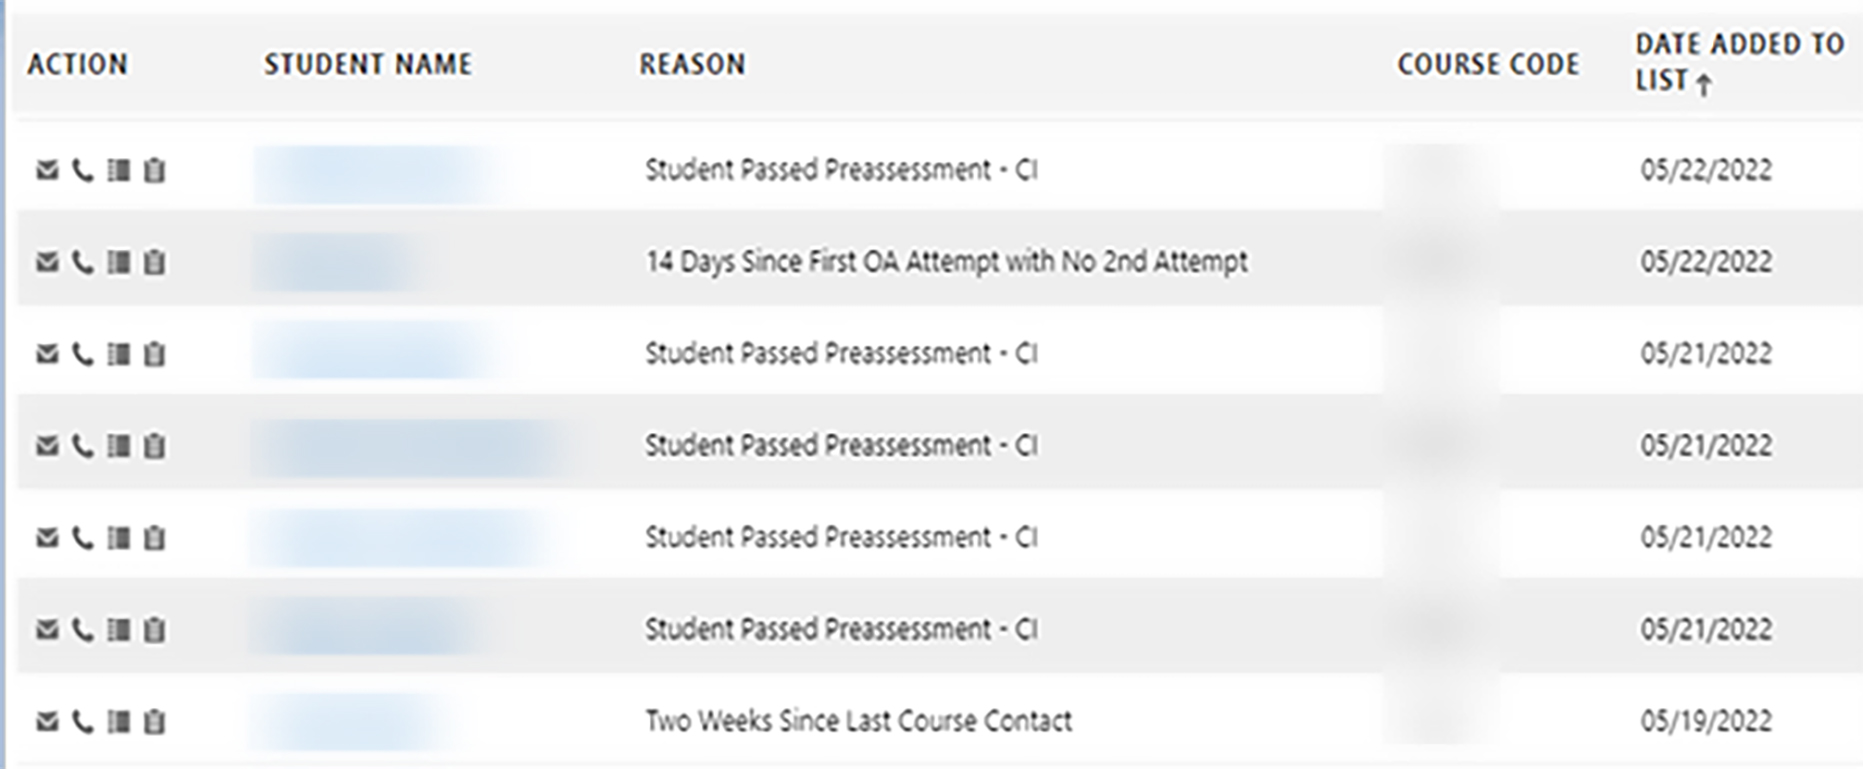
Image 1 shows an example of the LCD. Each EA has a recommended response time called a Service Level Agreement (SLA). For example, when a student passes a pre-assessment, the SLA recommends that faculty reach out within 24 hours with personalized, focused study recommendations and encouragement to continue. Outreach may involve congratulations, encouragement, or support in the form of resources, a 1:1 appointment, or an invitation to a related live web conference event. Furthermore, outreach may occur via several modalities including email, short message service (SMS), phone call, or online video conference. Students receive outreach via the LCD in every course for their entire time at WGU. While all faculty use the LCD dashboard, the amount and timeliness of their outreach varies—as will be seen in the results section. Overall, participation was strong with 69% of faculty responding to at least 50% of their EAs on time and only 0.3% of faculty failing to respond to any EAs on time. Even response rates below 50% involve a high level of participation, as most faculty received hundreds, or even thousands, of EAs during the study period.
Although WGU could have automated LCD outreach, we believed that this would have blunted its effect, as outreach both provides feedback and builds relationships (Pascarella & Terenzini, 1978; Pascarella & Terenzini, 1980; Richardson et al., 2015; Tinto, 1975). Indeed, a burgeoning literature on instructor presence (Henderson & Schroeder, 2021) indicates that online students’ experience often improves when instructors feel like real people with which they can identify and form bonds. Furthermore, automated outreach would have violated the spirit of WGU’s larger LCF initiative with its emphasis on increased personalization, flexibility, and social support.
Image 1: A screenshot of the LCD with student names and course codes redacted. Reason refers to the Essential Action and Action refers to the responses available to the instructor, like a phone call, email, or meeting.
Evidence of Program Impact
A summary of WGU’s structure will help readers interpret our results. Rather than the traditional 16-week semester with a fixed number of courses, WGU students complete as many courses as they want during 6-month terms. Once a student demonstrates competency in a course through a combination of exams and applied activities, they pass the course; that could take 6 months, 1 day, or anything in between. Students can take courses serially or in parallel. We collected data on 100,444 undergraduate students during the term that lasted from December 2020 to May 2021. As most students enrolled in 3–4 courses during the term, we also had 356,243 distinct student-course combinations. We will clarify whether the unit of analysis is student or student-course combination in all subsequent analyses.
Throughout the term, students received outreach through LCD that may or may not have fallen within the SLA recommended timeframe. Since feedback’s effectiveness often depends on its timeliness (Leibold & Schwarz, 2015), we created SLA categories based on timeliness.
- • In SLA: Students (or student-course combinations) in this group received outreach in response to at least 50% of their EAs, AND at least 50% of that outreach occurred within the SLA recommended timeframe.
- • Outside SLA: Students (or student-course combinations) in this group received outreach in response to at least 50% of their EAs, AND at least 50% of that outreach occurred AFTER the SLA recommended timeframe.
- • No EA Outreach: Students (or student-course combinations) in this group did not receive outreach in response to at least 50% of their EAs.
Phrased less technically, students (or student-combinations) in the In SLA group received most of the outreach that they were due within the recommended timeframe. Students (or student course combinations) in the Outside SLA group received most of the outreach that they were due, but most of it was late. Finally, students (or student-course combinations) in the No EA Outreach group did not receive most of the outreach that they were due.
When we report drop rates, students are the unit of analysis, and when we report course completion rate student-course combinations are the unit of analysis. A preemptive look at Figures 1 and 2 will help to clarify this. In Figure 2, the Outside SLA group had a drop rate of 15.8%. This means that 15.8% of students who received most of the outreach that they were due—but most of it was late—dropped out between December 2020 and May 2021. The course completion rate results in Figure 1 are interpreted somewhat differently since student-course combination is the unit of analysis when we report course completion rate. In Figure 1, the course completion rate for the In SLA group was 83.8%. This means that in 83.8% of the instances where students were enrolled in courses that provided timely EA outreach, they passed the course.
The primary research questions were:
- 1. How does course completion rate compare between students who received outreach In SLA, Outside SLA, or not at all?
- 2. How do drop rates compare between students receiving outreach In SLA, Outside SLA, or not at all?
- 3. Does LCD outreach impact course completion rate and drop rates for all groups of students equally?
Regarding question 3, the groups of interest were (a) self-reported race/ethnicity, due to the longstanding educational achievement gap between races (Reardon et al., 2008) and (b) WGU’s own measure of student success likelihood called the On Time Progress Predicted Score (OTPPS). The OTPPS is the predicted likelihood that a student will progress through a term without delay. The five OTPPS categories are:
- • Very Low (VL): < 20% likelihood of progressing on schedule
- • Low (LO): 20%–49% likelihood of progressing on schedule
- • Moderate (MO): 50%–69% likelihood of progressing on schedule
- • Moderate High (MH): 70%–89% likelihood of progressing on schedule
- • Very High (VH): > 90% likelihood of progressing on schedule
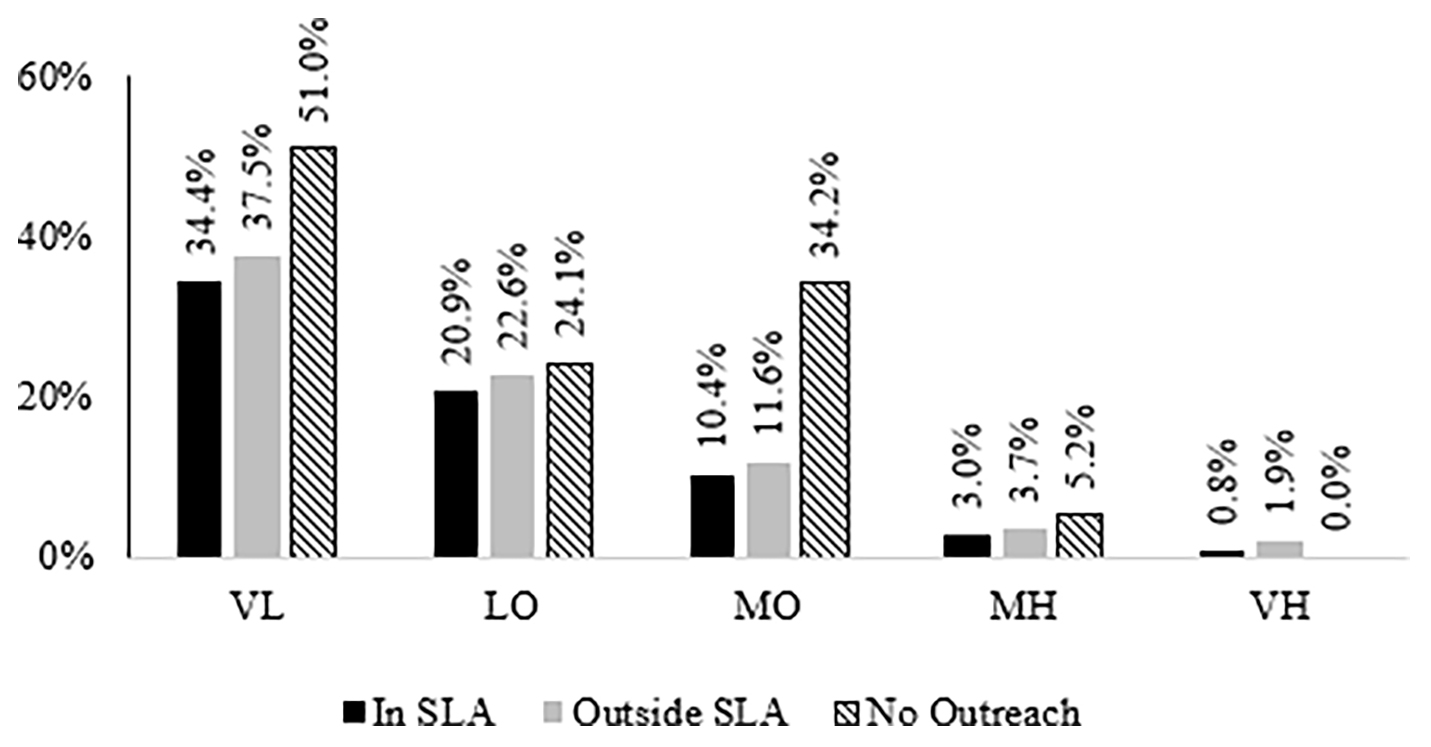
As these groups add another layer of complexity to our results, another preemptive look at Figures 3 and 6 is warranted. In Figure 6, the drop rate for White students in the In SLA group was 11.7%. This means that 11.7% of White students who received most of the outreach that they were due in a timely manner dropped out between December 2020 and May 2021. Student-course combination was the unit of analysis in Figure 3 because we were reporting course completion rate. The course completion rate for VL students in the No EA Outreach group was 15.8%. This means that in only 15.8% of the instances where VL students were enrolled in courses that provided less outreach than they were due, did they pass the course.
Results indicated LCD outreach benefitted students, particularly when it was delivered within the SLA recommendation. Figure 1 shows differences in course completion rate across the three SLA groups. In SLA student-course combinations (n = 199,674) had a 7.2% higher course completion rate than Outside SLA student-course combinations (n = 105,305) and 20.3% higher course completion rate than No EA Outreach (n = 51,264) student-course combinations. Outside SLA student-course combinations had a 13.1% higher course completion rate than No EA Outreach student-course combinations.
Figure 1. Course Completion Rate by Service Level Agreement Group
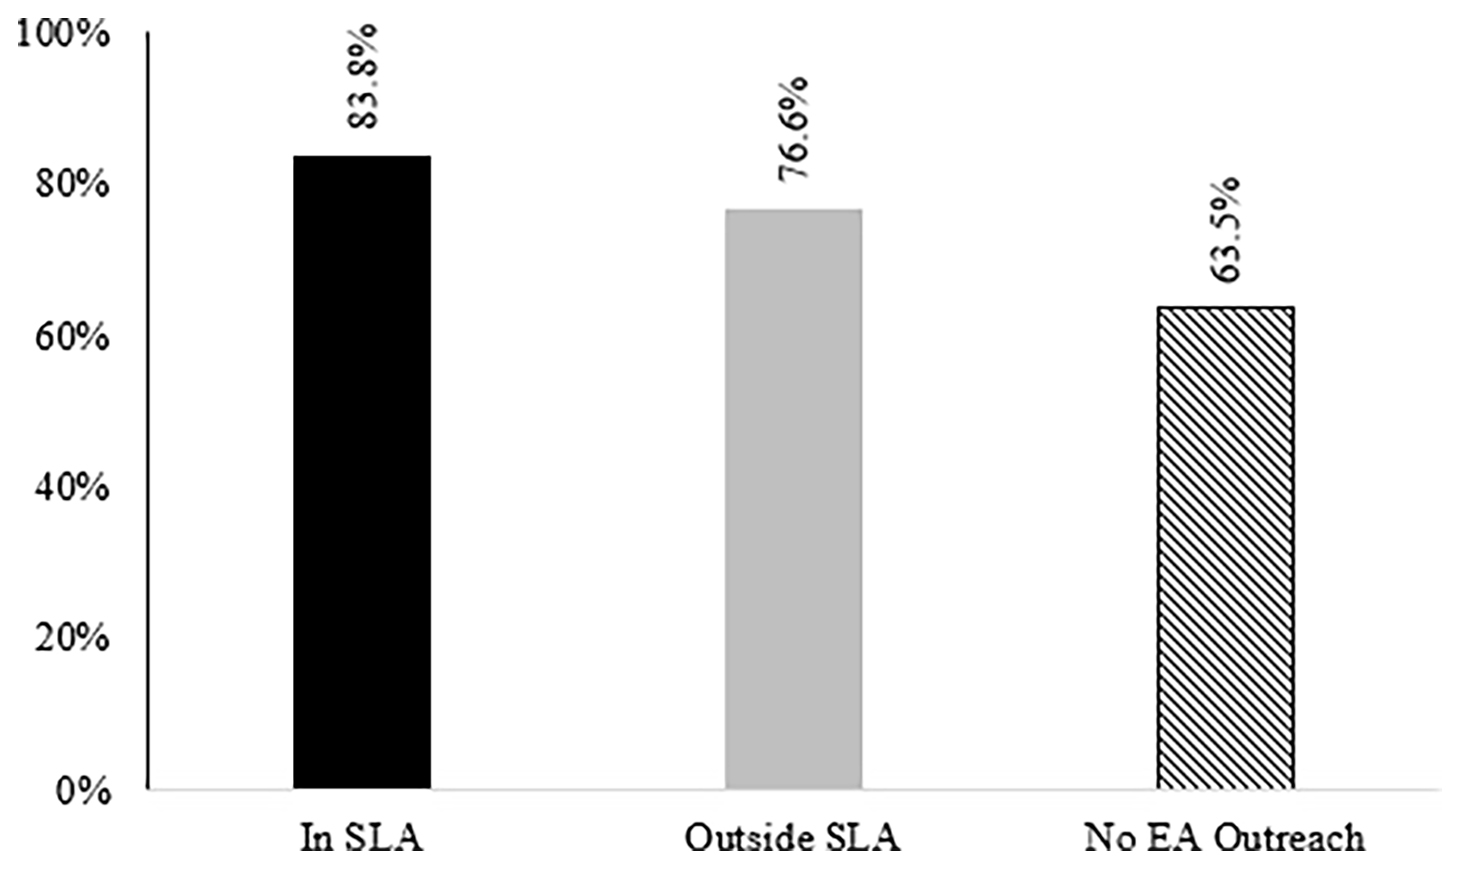
Note. SLA = Service Level Agreement; EA = Essential Actions.
The drop rate results in Figure 2 displayed a similar pattern to the course completion rate results in Figure 1. In SLA students (n = 58,106) had a 2.52% lower drop rate than Outside SLA students (n = 27,491), and a 16.4% lower drop rate than No EA Outreach students (n = 14,845). Outside SLA students had a 13.9% lower drop rate than No EA Outreach students.
Next, we examined whether outreach affected students in the five OTPPS categories equally. As students’ OTPPS category decreased, the benefit of outreach increased. Among VL (n = 30,383) and LO (n = 89,448) students, course completion rate differed by 21.1% (36.9% − 15.8% = 21.1%) and 25.5% (65.2% − 39.7% = 25.5%), respectively, between the No EA Outreach and In SLA groups, while the same differences were less than 2% for the MH (n = 151,184) and VH (n = 2,782) students. This indicates that outreach has a larger impact on lower OTPPS students (see Figure 3). We observed a similar though slightly weaker pattern when comparing MO (n = 82,991) students to MH or VH students. Additionally, outreach showed a disproportionately positive effect on course completion rate for VL, LO, and MO students relative to MH and VH students even in the Outside SLA groups.
Drop rates displayed a reciprocal pattern. That is, outreach—in both the In SLA and Outside SLA—disproportionately decreased drop rates for lower OTPPS students. Among VL (n = 11,446), LO (n = 30,232), and MO (n = 23,137) students, the difference in drops between the In SLA and No EA Outreach groups was 16.6%, 3.2%, and 23.8% respectively (see Figure 4). Drop rate differences, on average, for the MH (n = 34,736) and VH (n = 895) groups were substantially lower. A similar but somewhat weaker pattern occurred when comparing the Outside SLA group to the No EA Outreach group within the OPTTS groups.
Figure 2. Drop Rate by Service Level Agreement Group
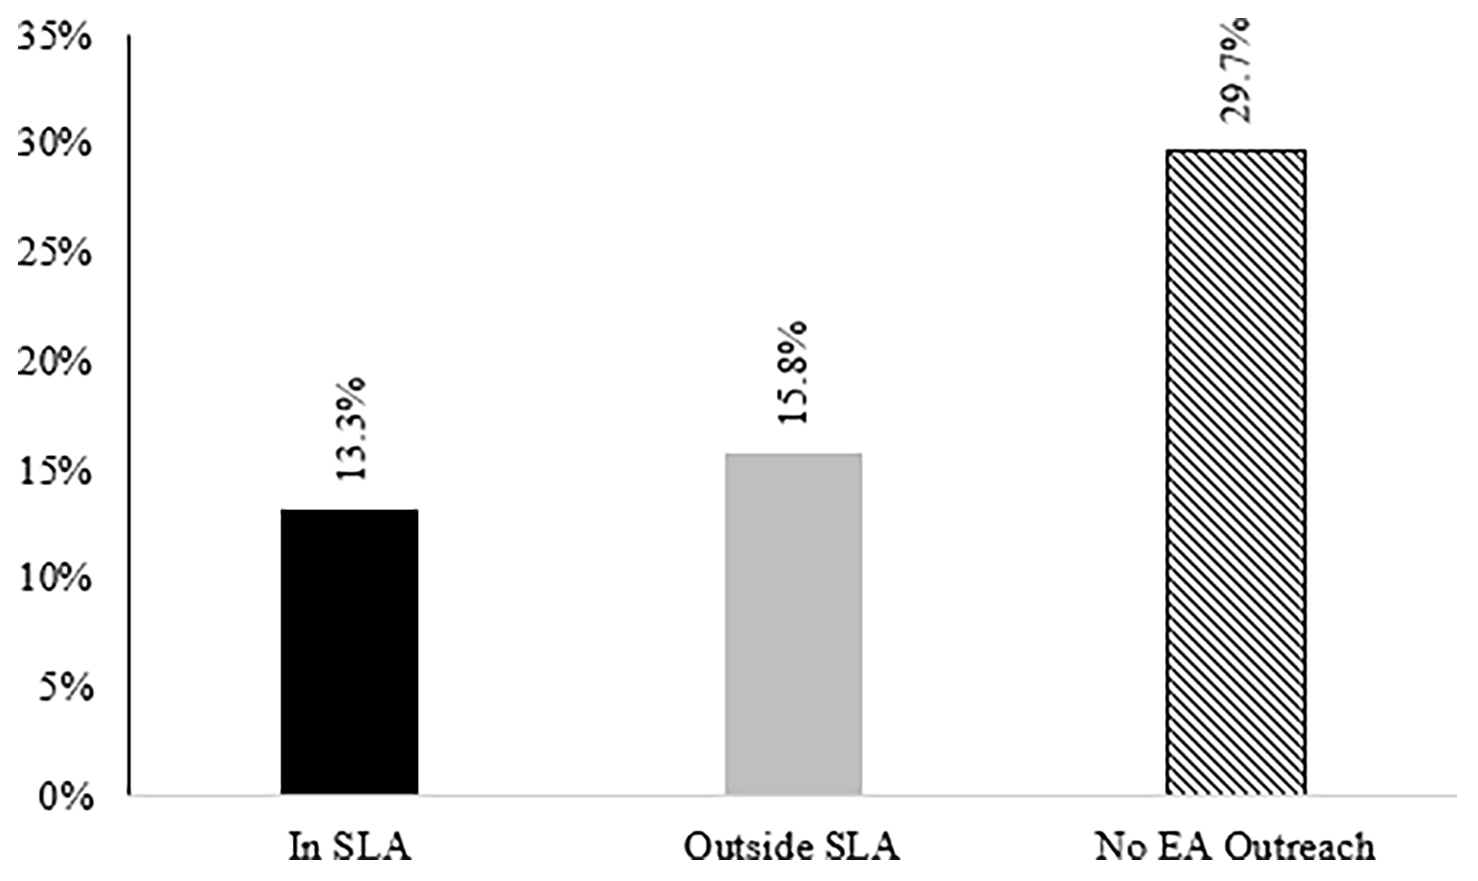
Note. SLA = Service Level Agreement; EA = Essential Actions.
Figure 3. Course Completion Rate by On Time Progress Predicted Score Group
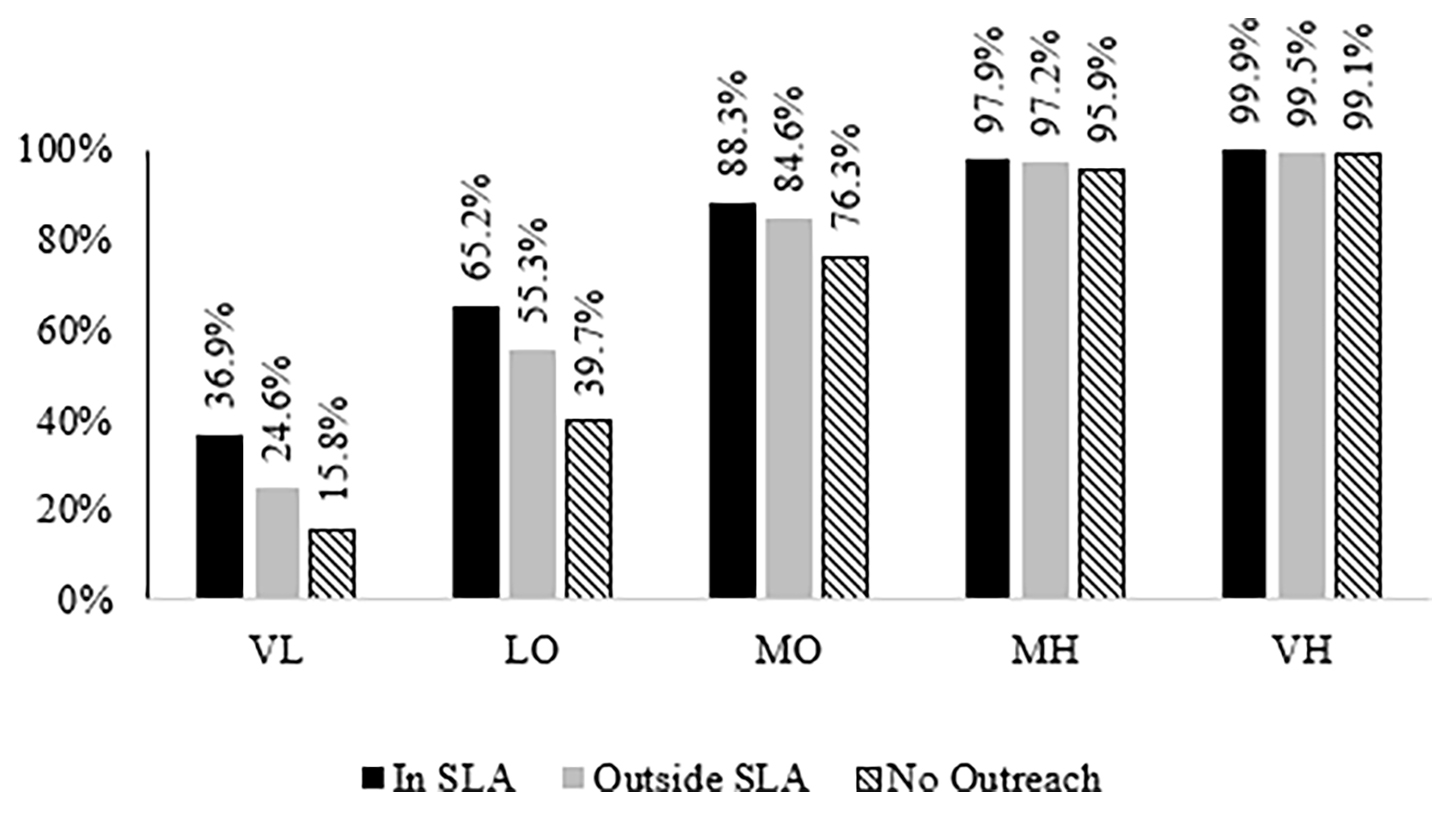
Note. SLA = Service Level Agreement; VL = very low (< 20%) likelihood of progressing on schedule; LO = low (20%–49%) likelihood of progressing on schedule; MO = moderate (50%–69%) likelihood of progressing on schedule; MH = moderate high (70%–89%) likelihood of progressing on schedule; VH = very high (> 90%) likelihood of progressing on schedule.
Figure 4. Drop Rate by On Time Progress Predicted Score Group
Note. SLA = Service Level Agreement; VL = very low (< 20%) likelihood of progressing on schedule; LO = low (20%–49%) likelihood of progressing on schedule; MO = moderate (50%–69%) likelihood of progressing on schedule; MH = moderate high (70%–89%) likelihood of progressing on schedule; VH = very high (> 90%) likelihood of progressing on schedule.
Figure 5. Course Completion Rate by Self-Reported Race/Ethnicity and Service Level Agreement Group
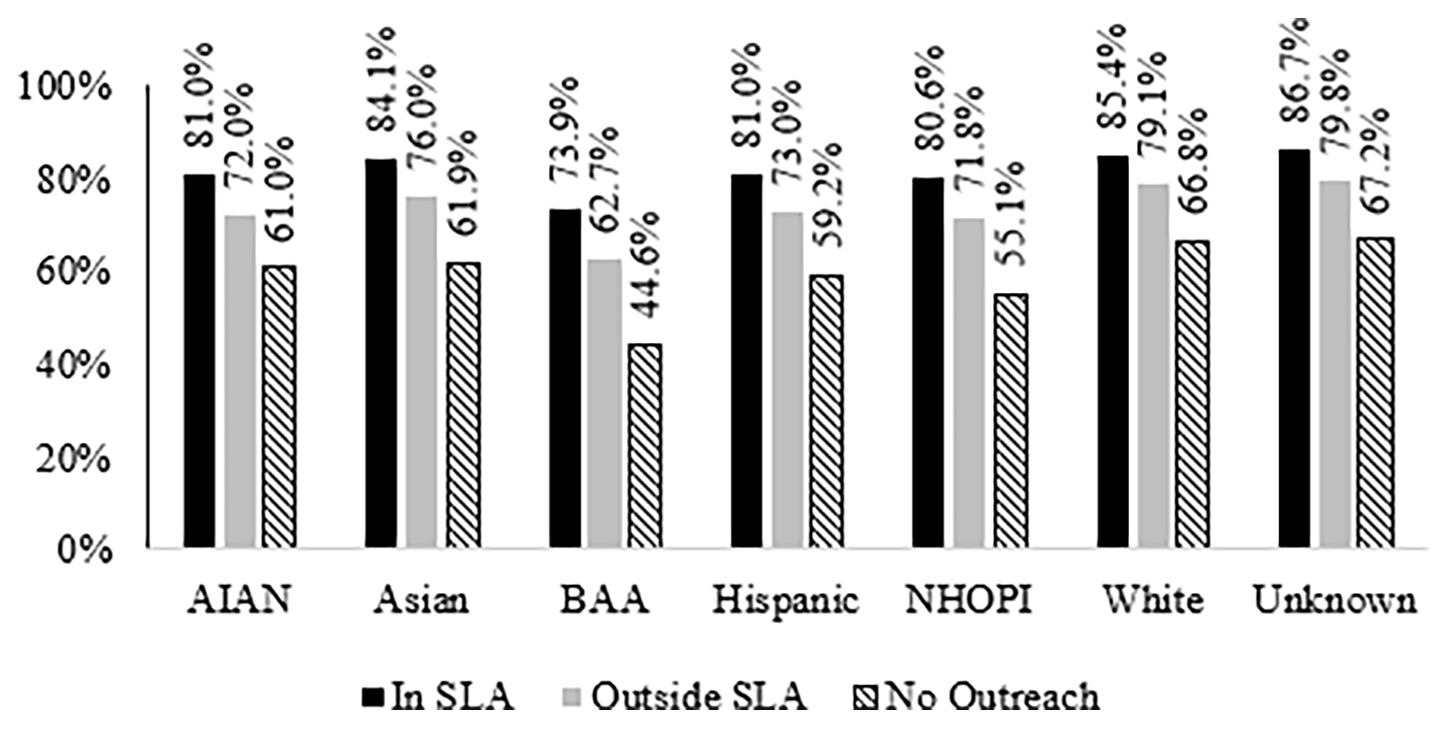
Note. SLA = Service Level Agreement; AIAN = American Indian or Alaska Native; BAA = Black or African American; NHOPI = Native Hawaiian or Other Pacific Islander.
We also examined differences in course completion rate and drop rates by self-reported race/ethnicity.
Course completion rate results indicate a greater difference between No EA Outreach and In SLA among students who identified as AIAN (n = 5,785), Asian (n = 12,815), BAA (n = 33,670), Hispanic (n = 38,387), or NHOPI (n = 1,955) than among students who identified as White (n = 211,399) or who did not have a race/ethnicity entry (n = 45,620). The largest difference (29.3%) was observed among students who identified as BAA, which was more than 10% greater than the difference observed among students who identified as White (18.6%). NHOPI students also showed relatively large response to outreach; however, the NHOPI margin of error is also relatively large given the small sample (see Figure 6).
Drop rate results showed some similar patterns to course completion rate. AIAN (n = 1,679) had a 23.1% difference between In SLA and No EA Outreach, while NHOPI (n = 568) had a 14.3% difference. Students who identified as BAA (14.4%; n = 9,630) or White (14.6%; n = 60,304) had similar differences between In SLA and No EA Outreach. Students who identified as Asian (n = 1,679) showed a 17.1% difference, Hispanic (n = 10,972) showed a 20.2% difference, and students without a reported race or ethnicity entry (n = 11,871) showed a 22.0% lower rate of drops. While response to outreach differed by race/ethnicity, amount of outreach did not. That is, all race/ethnicity groups received approximately equal amounts of faculty outreach (see Figure 7).
Figure 6. Drop Rate by Self-Reported Race/Ethnicity and Service Level Agreement Group
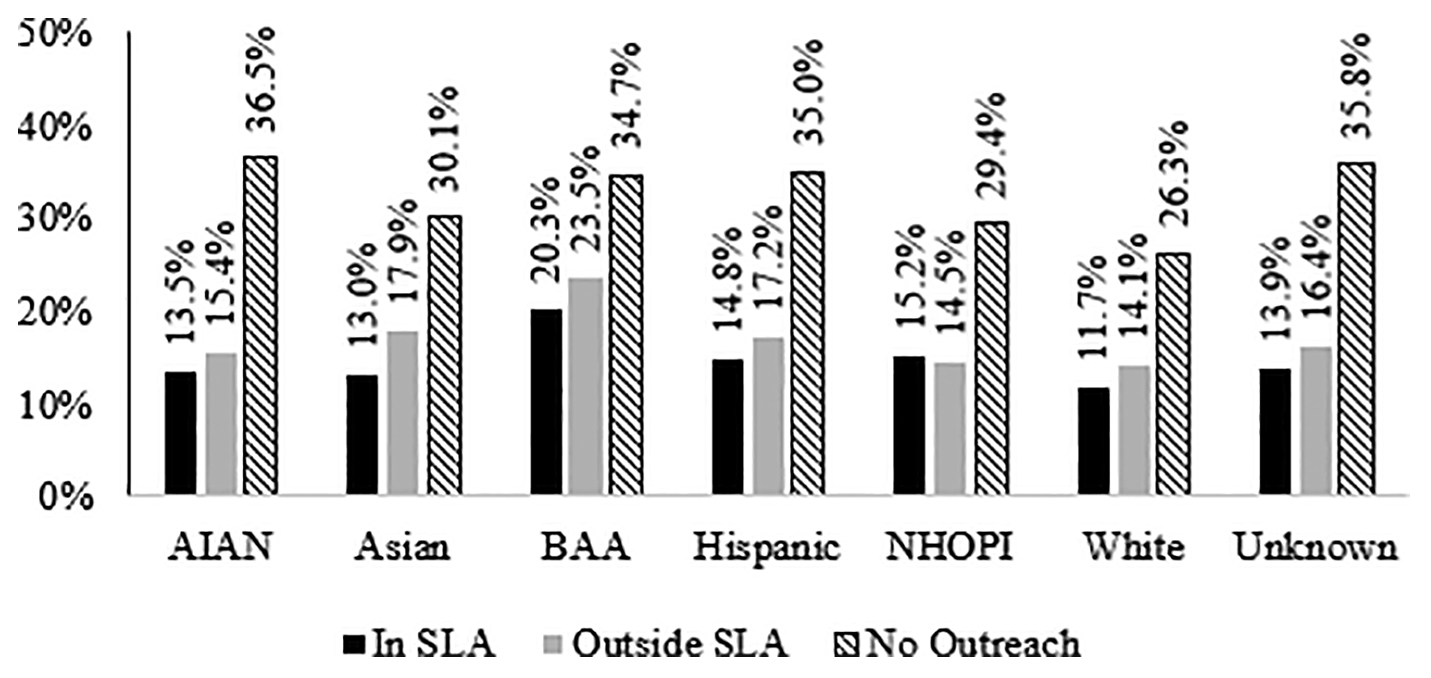
Note. SLA = Service Level Agreement; AIAN = American Indian or Alaska Native; BAA = Black or African American; NHOPI = Native Hawaiian or Other Pacific Islander.
Figure 7. In Service Level Agreement Percentages by Self-Reported Race/Ethnicity
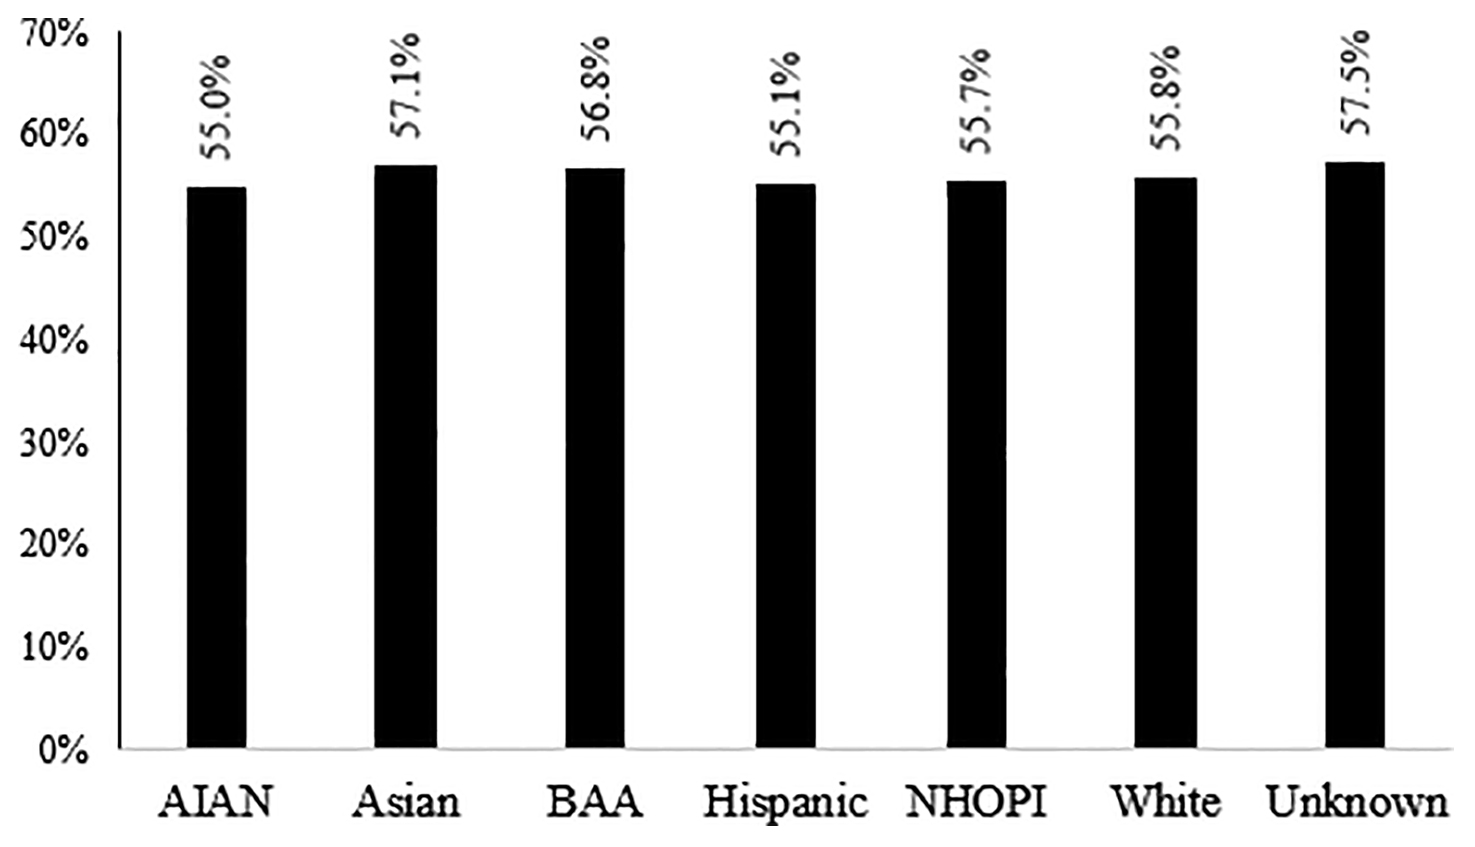
Note. AIAN = American Indian or Alaska Native; BAA = Black or African American; NHOPI = Native Hawaiian or Other Pacific Islander.
Conclusion
In 2019, WGU launched the Learner Centered Faculty (LCF) model and created several supporting tools. One tool—the Learner Care Dashboard (LCD)—provides a list of Essential Actions (EAs) that identify students for outreach in specific situations (such as passing a pre-assessment, being inactive for 2 weeks, and more). Each EA was assigned a target response time (referred to as a Service Level Agreement, SLA). The present study was a preliminary assessment of whether WGU’s outreach program improved student outcomes. Students showed higher course completion rate and lower drop rate when they received a majority of EA-based outreach within the SLA time window compared to receiving a majority of outreach outside the SLA period or having a majority of no EA-based outreach in the study period. Additionally, outreach carried a greater benefit for both lower OTPPS and non-White students.
Our analyses are a preliminary description of the effectiveness of a student outreach program implemented for students’ entire enrollment, in all classes, at an online university. As such, there are many open questions. For example, we have not identified the mechanisms that account for our overall or group-specific effects. Additionally, there are many ways to group students: age, gender, income, employment status, etc., and it is likely that any of these—individually or in combination—affect how they respond to outreach. Given that females have a six-year college graduation rate 7% higher than males (National Center for Education Statistics, 2022b), gender may be a promising area of future research. Our data, however, indicate that males and females respond similarly to outreach. For example, men who receive outreach within SLA have a 21.0% higher course completion rate than men who do not receive outreach. For females, this difference is 19.9%. For drop rate, males see a 15.5% decrease in response to outreach while females see a 17.3% decrease in response to outreach. In the current manuscript, we chose to focus on OTPPS and race given that there was a larger achievement gap within these categories than in any of the others that we may have chosen. We will explore these questions in future manuscripts. We will also examine the effect of different communication modalities (SMS, email, virtual meeting) as moderators of outreach effectiveness. For now, we believe that is enough to introduce and evaluate a novel and consistently implemented student outreach program.
Disclosure Statement: The authors do not have conflicts of interest or funding sources to disclose.
References
Baum, S. (2014). Higher education earnings premium: Value, variation, and trends. Urban Institute. https://www.urban.org/research/publication/higher-education-earnings-premium-value-variation-and-trends
Bawa, P. (2016). Retention in online courses: Exploring issues and solutions—A literature review. Sage Open, 6(1), 2158244015621777. https://doi.org/10.1177/2158244015621777
Carnevale, A. P., Campbell, K. P., Cheah, B., Gulish, A., Quinn, M. C., & Strohl, J. (2022). The uncertain pathway from youth to a good job: How limits to educational affordability, work-based learning, and career counseling impede progress toward good jobs. Georgetown University Center on Education and the Workforce. https://cew.georgetown.edu/cew-reports/pathway/
Cole, D., & Griffin, K. A. (2013). Advancing the study of student-faculty interaction: A focus on diverse students and faculty. In M. B. Paulsen (Ed.), Higher education: Handbook of theory and research (pp. 561–611). Springer.
Dayton, B., Gonzalez-Vasquez, N., Martinez, C. R., & Plum, C. (2004). Hispanic-serving institutions through the eyes of students and administrators. New Directions for Student Services, 2004(105), 29–40. https://doi.org/10.1002/ss.114
Endo, J. J., & Harpel, R. L. (1982). The effect of student-faculty interaction on students’ educational outcomes. Research in Higher Education, 16(2), 115–138. https://doi.org/10.1007/BF00973505
Fries-Britt, S., & Turner, B. (2002). Uneven stories: Successful Black collegians at a Black and a White campus. Review of Higher Education: Journal of the Association for the Study of Higher Education, 25(3), 315–330. https://doi.org/10.1353/rhe.2002.0012
Graunke, S. S., & Woosley, S. A. (2005). An exploration of the factors that affect the academic success of college sophomores. College Student Journal, 39(2), 367–377.
Hamilton, L. K., Boman, J., Rubin, H., & Sahota, B. K. (2019). Examining the impact of a university mentorship program on student outcomes. International Journal of Mentoring and Coaching in Education, 8(1), 19–36. https://doi.org/10.1108/IJMCE-02-2018-0013
Hattie, J., & Timperley, H. (2007). The power of feedback. Review of Educational Research, 77(1), 81–112. https://doi.org/10.3102/003465430298487
Henderson, M. L., & Schroeder, N. L. (2021). A systematic review of instructor presence in instructional videos: Effects on learning and affect. Computers and Education Open, 2, 100059. https://doi.org/10.1016/j.caeo.2021.100059
Herbert, M. (2006). Staying the course: A study in online student satisfaction and retention. Online Journal of Distance Learning Administration, 9(4), 300–317.
Huett, J. B., Kalinowski, K. E., Moller, L., & Huett, K. C. (2008). Improving the motivation and retention of online students through the use of ARCS-based e-mails. The American Journal of Distance Education, 22(3), 159–176. https://doi.org/10.1080/08923640802224451
Lamport, M. A. (1993). Student-faculty informal interaction and the effect on college student outcomes: A review of the literature. Adolescence, 28(112), 971–990.
LaPadula, M. (2003). A comprehensive look at online student support services for distance learners. The American Journal of Distance Education, 17(2), 119–128. https://doi.org/10.1207/S15389286AJDE1702_4
Law, D. D., Hales, K., & Busenbark, D. (2020). Student success: A literature review of faculty to student mentoring. Journal on Empowering Teaching Excellence, 4(1), Article 6. https://doi.org/10.15142/38x2-n847
Leibold, N., & Schwarz, L. M. (2015). The art of giving online feedback. Journal of Effective Teaching, 15(1), 34–46.
Mirowsky, J., & Ross, C. E. (1998). Education, personal control, lifestyle and health: A human capital hypothesis. Research on Aging, 20(4), 415–449. https://doi.org/10.1177/0164027598204003
National Center for Education Statistics. (2022a). Undergraduate retention and graduation rates. Condition of Education. U.S. Department of Education, Institute of Education Sciences. Retrieved May 31, 2022, from https://nces.ed.gov/programs/coe/indicator/ctr
National Center for Education Statistics. (2022b). Undergraduate retention and graduation rates. Condition of Education. U.S. Department of Education, Institute of Education Sciences. Retrieved November 3, 2022, from https://nces.ed.gov/programs/coe/indicator/ctr
Pascarella, E. T., & Terenzini, P. T. (1978). Student-faculty informal relationships and freshman year educational outcomes. Journal of Educational Research, 71(4), 183–189. https://doi.org/10.1080/00220671.1978.10885067
Pascarella, E. T., & Terenzini, P. T. (1980). Predicting freshman persistence and voluntary dropout decisions from a theoretical model. The Journal of Higher Education, 51(1), 60–75. https://doi.org/10.1080/00221546.1980.11780030
Plakht, Y., Shiyovich, A., Nusbaum, L., & Raizer, H. (2013). The association of positive and negative feedback with clinical performance, self-evaluation and practice contribution of nursing students. Nurse Education Today, 33(10), 1264–1268. http://doi.org/10.1016/j.nedt.2012.07.017
Rabe-Hemp, C., Woollen, S., & Humiston, G. S. (2009). A comparative analysis of student engagement, learning, and satisfaction in lecture hall and online learning settings. Quarterly Review of Distance Education, 10(2), 207–218.
Reardon, S. F., Robinson, J. P., & Weathers, E. S. (2008). Patterns and trends in racial/ethnic and socioeconomic academic achievement gaps. In H. F. Ladd & E. B. Fiske (Eds), Handbook of research in education finance and policy (pp. 497–516). Routledge.
Richardson, J. C., Koehler, A. A., Besser, E. D., Caskurlu, S., Lim, J., & Mueller, C. M. (2015). Conceptualizing and investigating instructor presence in online learning environments. The International Review of Research in Open and Distributed Learning, 16(3). https://doi.org/10.19173/irrodl.v16i3.2123
Roberts, J., & Styron Jr, R. (2010). Student satisfaction and persistence: Factors vital to student retention. Research in Higher Education Journal, 6, 15–29.
Rovai, A. P. (2001). Building classroom community at a distance: A case study. Educational Technology Research and Development, 49(4), 33–48. https://doi.org/10.1007/BF02504946
Sandner, M. (2015). The effects of high-quality student mentoring. Economics Letters, 136, 227–232. https://doi.org/10.1016/j.econlet.2015.09.043
Shackelford, J. L., & Maxwell, M. (2012). Sense of community in graduate online education: Contribution of learner to learner interaction. International Review of Research in Open and Distributed Learning, 13(4), 228–249.
Shelton, E. N. (2003). Faculty support and student retention. Journal of Nursing Education, 42(2), 68–76. https://doi.org/10.3928/0148-4834-20030201-07
Sher, A. (2009). Assessing the relationship of student-instructor and student-student interaction to student learning and satisfaction in web-based online learning environment. Journal of Interactive Online Learning, 8(2), 102–120.
Simpson, O. (2008). Motivating learners in open and distance learning: Do we need a new theory of learner support? Open Learning: The Journal of Open, Distance and e-Learning, 23(3), 159–170. https://doi.org/10.1080/02680510802419979
Thompson, M. D. (2001). Informal student-faculty interaction: Its relationship to educational gains in science and mathematics among community college students. Community College Review, 29(1), 35–57. https://doi.org/10.1177/009155210102900103
Tinto, V. (1975). Dropout from higher education: A theoretical synthesis of recent research. Review of Educational Research, 45(1), 89–125. https://doi.org/10.2307/1170024
Weaver, M. R. (2006). Do students value feedback? Student perceptions of tutors’ written responses. Assessment & Evaluation in Higher Education, 31(3), 379–394. https://doi.org/10.1080/02602930500353061