Basic Needs Insecurity and College Students’ Mental Health During the COVID-19 Pandemic
Krista M. Soria*
University of Idaho
Abstract
I examined the relationship between basic needs insecurity and college students’ mental health during the COVID-19 pandemic. The sample included 49,122 students enrolled at 130 community and technical colleges and 72 four-year institutions across 42 states in fall 2020. I used propensity score matching techniques to construct matched pairs of students who did and did not experience basic needs insecurity using covariates (i.e., individual characteristics, environmental/institutional variables, and COVID-19 experiences). The results suggest that low and very low food security and housing insecurity have significant and positive relationships with students’ odds of experiencing moderate to severe major depressive disorder and generalized anxiety disorder symptoms, controlling for additional variables.
Keywords: basic needs insecurity, major depressive disorder, generalized anxiety disorder
* Contact: ksoria@uidaho.edu

© 2023 Soria. This open access article is distributed under a Creative Commons Attribution 4.0 License (https://creativecommons.org/licenses/by/4.0/)
Basic Needs Insecurity and College Students’ Mental Health During the COVID-19 Pandemic
In March 2020, the World Health Organization declared a global pandemic for an outbreak of severe acute respiratory syndrome coronavirus 2 (SARS-CoV-2), the virus that causes coronavirus disease (COVID-19). In response, many higher education institutions in the United States shifted their classes from in-person to remote modalities, closed on-campus living facilities and buildings, requested that students who lived on campus relocate off campus, and required most faculty and employees to work remotely. An estimated 1,300 colleges or universities canceled in-person classes and over 80% of college students had some or all of their classes moved to online-only instruction (Cameron et al., 2021; Smalley, 2021). Although many campus operations have returned to pre-pandemic levels of services or stabilized over the last two years—often with modifications, such as masking, enhanced cleaning procedures, or social distancing—there has been a proliferation of research about the effects of the ongoing pandemic on college students’ experiences and outcomes. In particular, researchers have drawn attention to the notable increases in college students’ symptoms of major depressive disorder (MDD) and generalized anxiety disorder (GAD) during the COVID-19 pandemic (Charles et al., 2021; Fruehwirth et al., 2021; Kim et al., 2021; Soria & Horgos, 2021; Wang et al., 2020).
Although the rates of clinically significant MDD and GAD symptoms have been rising among college students over the decades, as the pandemic unfolded, there were precipitous increases in MDD and GAD symptomology in college students (Charles et al., 2021; Fruehwirth et al., 2021; Kim et al., 2021; Wang et al., 2020). Prior to the pandemic, the rates of MDD were estimated to be between 36%–39% and the rates of GAD were estimated to be 29%–31% among undergraduates (Kim et al., 2021; Wang et al., 2020). The rates of MDD for undergraduates during the initial months of the pandemic were estimated at approximately 35%–59% and 31%–51% for GAD (Kim et al., 2021; Soria & Horgos, 2021; Wang et al., 2020; Zimmerman et al., 2021). While those rates vary based upon the samples, settings, and different institutions used in the studies, they signal an upward trend of MDD and GAD rates among students during pandemic.
Researchers have discovered several factors that are associated with students’ MDD and GAD symptoms during the pandemic; for instance, many college students experienced sleep disruptions, difficulty concentrating, high levels of stress and worry, lower physical activity, and loneliness that were associated with higher rates of psychological stress and mental health disorders (Benham, 2020; Birmingham et al., 2021; Clabaugh et al., 2021; Copeland et al., 2021; Salimi et al., 2021; Son et al., 2020; Ulrich et al., 2021; Zimmerman et al., 2021). Scholars have also found that the financial hardships students encountered during the pandemic, including basic needs insecurity, are associated with increases in students’ MDD and GAD symptoms (Soria & Horgos, 2021; Soria, Kelling, et al., 2022). However, while there is growing evidence that there may be relationships between students’ basic needs insecurity and mental health disorders, current studies are limited by restrictive samples, measures, and methodology. For instance, Martinez et al. (2020) only examined food insecurity (not housing insecurity) and its associations with mental health among college students enrolled in the University of California system. The authors used a latent construct of overall poor mental health rather than specific measures of clinically significant GAD and MDD symptomology. While Soria and Horgos and Soria, Kelling, et al. used validated measures of GAD and MDD symptoms, they examined only four-year students enrolled at large public research universities, who tend to have lower rates of food/housing insecurity compared to students enrolled at other types of institutions (The Hope Center for College, Community, and Justice, 2021).
Further, none of the aforementioned authors isolated the potential effects of basic needs insecurity on students’ MDD or GAD symptoms above and beyond the effects of other confounding variables (Martinez et al., 2020; Soria & Horgos, 2021; Soria, Kelling, et al., 2022). The purpose of this study is therefore to examine the relationship between food and housing insecurity and college students’ clinically significant GAD and MDD symptoms during the COVID-19 pandemic. To address the limitations from other research, I used a sample of students enrolled at both two-year and four-year institutions, incorporated robust measures of food and housing insecurity and mental health disorders, and selected propensity score matching techniques to reduce potential bias from covariates and better estimate the relationships between the independent variables (food and housing insecurity) and the dependent variables of MDD and GAD symptoms (Austin, 2011). I used propensity score matching techniques to construct matched pairs of college students who experienced food or housing insecurity with students who did not experience food or housing insecurity. I estimated the conditional probability of experiencing food and housing insecurity given a set of observed covariates including students’ individual characteristics, environmental/institutional variables, and COVID-19 experiences.
Basic Needs Insecurity Among College Students
The rates of basic needs insecurity, including food and housing insecurity, has been increasing among college and university students in the United States (Broton & Goldrick-Rab, 2018; Goldrick-Rab et al., 2018; Nazmi et al., 2019). Notably, a large proportion of college students experienced basic needs insecurity during the COVID-19 pandemic. Among a sample that included college students enrolled in two-year and four-year institutions, 34% of students experienced food insecurity and 48% experienced housing insecurity during the pandemic (The Hope Center for College, Community, and Justice, 2021). Food insecurity is a multifaceted concept commonly defined as the limited availability of nutritious foods, uncertain ability to acquire nutritious foods, or the inability to acquire nutritious foods (Anderson, 1990; Nikolaus et al., 2020). Food insecurity also constitutes interrupted eating patterns or a reduction in the quality of diet due to the lack of resources to access nutritious food (Coleman-Jensen et al., 2020). Housing insecurity is also a multifaceted form of basic needs insecurity that includes lacking the ability to pay rent, mortgage, or utilities; experiencing increases in the cost of housing that make it difficult to afford housing; lacking affordable housing alternatives; living with others beyond the expected capacity of the residence; staying temporarily with others (e.g., couch surfing); living in places not designed for human habitation (e.g., vehicle); moving three or more times in a year; or experiencing homelessness (Broton & Goldrick-Rab, 2018; Goldrick-Rab et al., 2018, 2019; The Hope Center for College, Community, and Justice, 2021).
Both food and housing insecurity have negative effects on college students’ experiences and outcomes. Food insecurity is associated with reduced odds of college graduation, including a lower likelihood of obtaining a bachelor’s degree or a graduate or professional degree (Wolfson et al., 2022). Additionally, food insecurity is associated with lower grade point average, poorer health, decreased quality of sleep, disruptions in academic progress (e.g., dropping classes, missing classes, neglecting academics), and higher rates of stress or psychological distress (Collier et al., 2021; Leung et al., 2021; Martinez et al., 2020; Meza et al., 2019). Housing insecurity is similarly associated with lower grade point average, poorer health, and lower college completion rates (Leung et al., 2021; Smith & Knechtel, 2020). Therefore, basic needs insecurity among college students is a significant problem that warrants attention from higher education practitioners, researchers, and policymakers.
There are also variables associated with students’ basic needs insecurity or mental health disorder symptoms that influenced the selection of variables used in matching procedures for the present study. For instance, students of color, students from minoritized sexual orientations or genders, first-generation students, students with disabilities, older students, students who had previously been in foster care systems, students who are parents or caregivers to children, Pell grant recipients, and students who are enrolled part-time tend to disproportionately experience basic needs insecurity or MDD/GAD symptoms compared to their peers (Broton, 2020; Broton & Goldrick-Rab, 2018; Goldrick-Rab et al., 2018, 2019; Soria & Horgos, 2021; Soria, Horgos, & Shenouda, 2022; The Hope Center for College, Community, and Justice, 2021). Students enrolled at two-year colleges and in colleges located in specific regions of the country (e.g., West) also have higher rates of basic needs insecurity compared to their peers (The Hope Center for College, Community, and Justice, 2021). Students’ experiences during the COVID-19 pandemic, including caretaking responsibilities or financial hardships, are also associated with students’ basic needs insecurity or mental health disorder symptoms (Soria & Horgos, 2021; Soria, Horgos, & Shenouda, 2022; The Hope Center for College, Community, and Justice, 2021).
Conceptual Framework
The conceptual framework incorporates components of Fink’s (2014) integrated model of college students’ mental health, Glover et al.’s (2020) conceptual framework for mitigating the equity harms of COVID-19, and prior integrations of both models in the novel contexts related to college students’ mental health during the COVID-19 pandemic (Soria & Horgos, 2021; Soria, Kelling, et al., 2022).
Fink (2014) explored the role of individual characteristics and environmental/institutional variables in college students’ mental health, with the primary purpose of better illuminating how the college environment matters in promoting positive mental health. While prior researchers focused primarily on the demographic factors associated with college students’ mental health, Fink contended that the collegiate environment was equally as important in helping students to flourish. Therefore, Fink included not only the individual characteristics of students’ gender, race/ethnicity, sexual orientation, parents’ education, and parents’ income, but also environmental/institutional variables including years of college exposure and residence. Fink’s sample was relatively homogenous (i.e., mostly full-time students enrolled at large public institutions), so in the present study I extended Fink’s model by including additional environmental/institutional variables including students’ enrollment intensity, type of institution, and the region of the institution.
Glover et al. (2020) stipulated that inequitable COVID-19 policies may generate additional harms upon individuals who were marginalized, oppressed, and disenfranchised prior to the pandemic. For instance, stay-at-home or shelter-in-place policies may have reduced the ability for college students from low-income backgrounds to work and earn wages at their pre-pandemic rates, thus exacerbating their propensity to experience basic needs insecurity and potentially worsening their psychological stress or mental health disorder symptoms. Glover et al. used similar individual characteristics and environmental variables as Fink (2014), but also included disability, employment, and age as characteristics placing people at risk for experiencing disproportionately more harms from COVID-19 policies, such as elevations in basic needs insecurity.
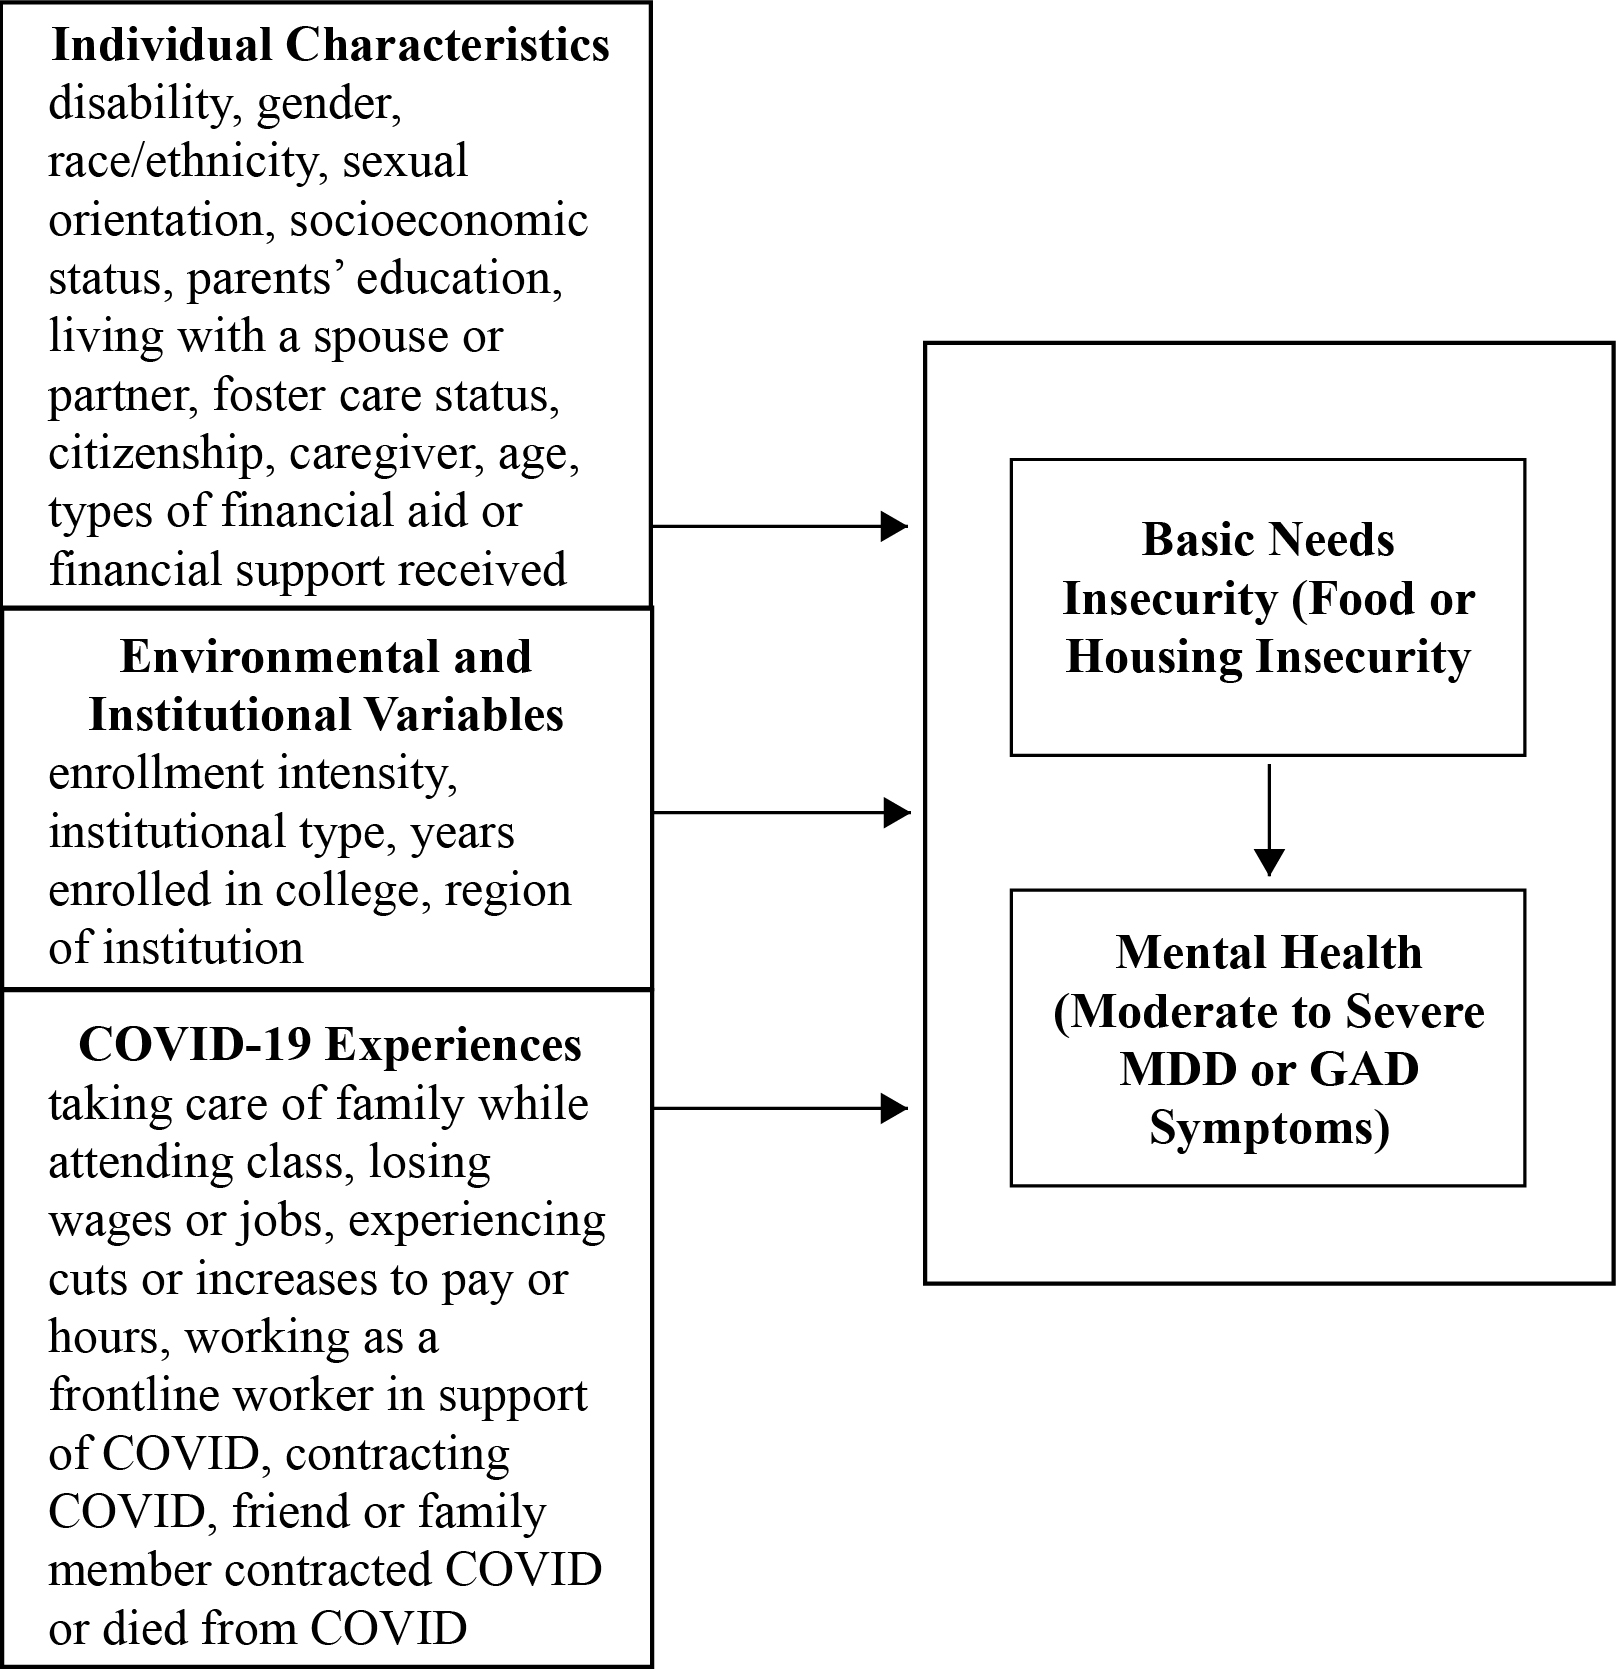
Scholars who examined college students’ mental health during the pandemic have integrated Fink’s (2014) and Glover et al.’s (2020) individual characteristics and environmental/institutional variables while also contributing additional individual characteristics and health and safety, academic, and financial variables associated with the pandemic (Soria & Horgos, 2021; Soria, Kelling, et al., 2022). Those additional variables include caregiver status, citizenship, food insecurity, housing insecurity, academic obstacles (e.g., taking care of family members while attending class), and financial hardships (e.g., losing a job, losing wages). In the present study, I incorporated individual characteristics, environmental/institutional variables, and COVID-19 experiences into a conceptual framework for college students’ basic needs insecurity and mental health during the COVID-19 pandemic (Figure 1).
Figure 1. Conceptual Framework for College Students’ Basic Needs Insecurity and Mental Health During the COVID-19 Pandemic
Methodology
Instrument & Sample
I used data from the 2020 #RealCollege Survey (The Hope Center for College, Community, and Justice, 2022), which was administered to 1.84 million college students at 130 community and technical colleges and 72 four-year colleges in 42 states from September to November of 2020. The survey was emailed to students, and it was framed as a survey about college life, not about basic needs insecurity. The response rate averaged 10.6% (n = 195,629), although only a smaller subset of students who were also enrolled in the previous spring semester answered items related to their COVID-19 experiences during that term (n = 118,698). From that subset, I reduced the sample via listwise deletion of missing responses, which primarily occurred at the end of the survey due to response attrition (n = 61,097). The data were not missing completely at random (Little’s [1988] MCAR test: χ2 = 902.634, p < 0.001) and the variable with the highest number of missing responses (20.7%) was students’ age, followed by additional demographic variables that were located at the end of the survey (e.g., gender, 19.6%; race/ethnicity, 19.9%). When data are missing not at random, there may be systematic differences between the respondents who have missing data and those who have complete data; therefore, estimates may be biased and results should be interpreted with caution.
Although low, the response rate was the highest for any #RealCollege Survey administration and is comparable to response rates for similar surveys (Betancourt & Wolff-Eisenberg, 2019; California Student Aid Commission, 2020; The Hope Center for College, Community, and Justice, 2021). It is not possible to compare the representativeness of the respondents with the original sample of students who were administered the survey because those data were not provided by institutions and, in many cases, higher education institutions do not systematically collect or report data on some demographic variables (e.g., disability).
In the sample, 59.8% of students had experienced either food insecurity or housing insecurity and I matched that group with students who did not experience either food insecurity or housing insecurity. The final sample included 24,561 students who experienced at least one form of basic needs insecurity and 24,561 students who did not experience at least one form of basic needs insecurity. The demographic information from the final sample of 49,122 students used in the analysis is shown in Table 1. The sample was relatively balanced with regard to students’ enrollment in two-year (51.4%) and four-year (48.6%) colleges; however, the sample may not reflect the significant diversity at many colleges and universities because the majority of respondents were women (70.0%), White (51.7%), heterosexual or straight (78.0%), enrolled full-time (57.5%), and U.S. citizens or permanent residents (95.7%; Table 1).
Measures
Dependent Variables
The dependent measures include a nine-item scale to screen for MDD symptoms known as the Patient Health Questionnaire-2 (PHQ-9; Kroenke et al., 2001). The PHQ-9 includes nine questions about the frequency of depressed mood and anhedonia (e.g., “feeling down, depressed, or hopeless”) over the past two weeks. The PHQ-9 has excellent internal consistency (α = 0.89), test-retest reliability, and criterion, construct, factorial, and procedural validity (Kroenke et al., 2001). The scale also has excellent internal consistency in the present study (α = 0.916).
I also used a seven-item scale to screen students for GAD symptoms known as the GAD-7 (Spitzer et al., 2006). The GAD-7 includes seven questions about the frequency of anxiety (e.g., “feeling nervous, anxious, or on edge”) over the past two weeks (0 = not at all to 3 = nearly every day). The GAD-7 has excellent internal consistency (α = 0.92), test-retest reliability (intraclass criterion = 0.83), and criterion, construct, factorial, and procedural validity (Spitzer et al., 2006). The scale also has excellent internal consistency in the present study (α = 0.931).
Table 1. Descriptive Statistics for the Sample
|
% |
SE |
|
|---|---|---|
|
Chronic illness |
5.4 |
0.02 |
|
Cognitive, learning, or neurological disorder or disability |
3.7 |
0.01 |
|
Other disability or medical condition |
0.9 |
0.00 |
|
Physical disability |
1.1 |
0.00 |
|
Psychological disorder |
17.6 |
0.08 |
|
Multiple disabilities |
17.2 |
0.08 |
|
No disability or medical condition |
54.1 |
0.24 |
|
Women |
70.0 |
0.31 |
|
Men |
26.4 |
0.12 |
|
Nonbinary |
1.1 |
0.00 |
|
Transgender |
1.3 |
0.00 |
|
Prefer to self-describe or not to provide gender |
1.1 |
0.00 |
|
Black or African American |
8.9 |
0.04 |
|
Middle Eastern, North African, Arab, or Arab American |
0.8 |
0.00 |
|
Southeast Asian |
2.1 |
0.01 |
|
American Indian or Native American |
0.4 |
0.00 |
|
Hispanic, Latinx, or Chicanx |
15.9 |
0.07 |
|
Pacific Islander or Native Hawaiian |
0.2 |
0.00 |
|
Other (non-Southeast) Asian or Asian American |
4.4 |
0.02 |
|
White |
51.7 |
0.23 |
|
Multiracial |
13.3 |
0.06 |
|
No race/ethnicity provided |
2.2 |
0.01 |
|
Heterosexual or straight |
78.0 |
0.35 |
|
Gay or lesbian |
4.0 |
0.02 |
|
Bisexual |
10.8 |
0.05 |
|
Prefer to self-describe sexual orientation |
2.9 |
0.01 |
|
Prefer not to answer sexual orientation |
4.3 |
0.02 |
|
Family had trouble making ends meet financially growing up |
36.3 |
0.16 |
|
Family did not have making ends meet financially growing up |
63.7 |
0.29 |
|
Continuing generation (parents have ≥ a bachelor’s degree) |
41.2 |
0.18 |
|
First-generation (parents have < a bachelor’s degree) |
58.8 |
0.26 |
|
Student does not live with a spouse or partner |
72.1 |
0.32 |
|
Student lives with a spouse or partner |
27.9 |
0.12 |
|
Part-time enrollment |
42.5 |
0.19 |
|
Full-time enrollment |
57.5 |
0.26 |
|
Student was not formerly in foster care |
98.3 |
0.44 |
|
Student was formerly in foster care |
1.7 |
0.00 |
|
International student |
4.3 |
0.02 |
|
U.S. citizen or permanent resident |
95.7 |
0.43 |
|
Student is not a parent, guardian, or caregiver to children |
83.3 |
0.37 |
|
Student is a parent, guardian, or caregiver to children |
16.7 |
0.07 |
|
Enrolled in a four-year college |
48.6 |
0.22 |
|
Enrolled in a two-year college |
51.4 |
0.23 |
|
College is in the Midwest |
17.2 |
0.08 |
|
College is in the South |
31.7 |
0.14 |
|
College is in the Northeast |
14.0 |
0.06 |
|
College is in the West |
37.1 |
0.17 |
|
Uses Pell grants to pay for college |
40.1 |
0.18 |
|
Uses student loans to pay for college |
34.1 |
0.15 |
|
Has a job (to pay for college) |
65.8 |
0.29 |
|
Pays for college with support from family/friends |
52.9 |
0.24 |
|
Had to take care of a family member while attending class |
32.7 |
0.15 |
|
Had to help children in the home with their schooling while attending classes |
25.7 |
0.11 |
|
Lost a job |
24.6 |
0.11 |
|
Struggled to pay to go back home |
4.2 |
0.02 |
|
Could not afford to go back home |
2.2 |
0.01 |
|
Experienced cuts to hours or pay at work |
38.3 |
0.17 |
|
Experienced an increase in hours or pay at work |
18.1 |
0.08 |
|
Worked as a frontline worker supporting COVID |
11.7 |
0.05 |
|
Was sick with COVID |
5.4 |
0.02 |
|
A close friend or family member was sick with COVID |
36.8 |
0.16 |
|
A close friend or family member died of COVID |
9.3 |
0.04 |
To reduce the number of items students completed, they responded to two items on the PHQ-2 and GAD-7. If they met a threshold (< 2), they completed the remaining items. I summed the scores and used the recommended cut-off point of PHQ-9 ≥ 15, which indicates a moderate to severe level of depression (Kroenke et al., 2001), and GAD-7 ≥ 10, which represents a moderate to severe level of anxiety. In the final matched pairs sample, 34.7% of students had clinically significant symptoms of moderate to severe MDD and 34.9% had clinically significant symptoms of moderate to severe GAD. Both the PHQ-9 and GAD-7 are used by clinicians as “screeners” for MDD and GAD; however, the instruments are not diagnostic tools in-and-of themselves. Individuals who meet clinically significant criteria for MDD and GAD should receive further evaluation from clinicians (Spritzer et al., 2006).
Independent Variables
The survey assessed students’ recent food security using the U.S. Department of Agriculture’s (USDA, 2012) 18-item set of questions (e.g., “In the last 30 days, did you ever cut the size of your meals or skip meals because there wasn’t enough money for food?”). The sum of affirmative responses represents students’ raw food insecurity score, recoded to 1 = high food security (raw score 0), 2 = marginal food security (raw score 1–2), 3 = low food security (raw score 3–7 if children present and 3–5 if no children present in the home), and 4 = very low food security (raw score 8–18 if children present in the home and 6–10 if no children present in the home). In the final matched pairs sample, 59.9% of students had high food security, 14.6% marginal food security, 11.9% low food security, and 13.6% very low food security.
The survey also assessed students’ recent housing insecurity using 10 items (e.g., “In the past 12 months, was there a rent or mortgage increase that made it difficult to pay?”). Students were coded as experiencing housing insecurity if they responded “yes” to any of the items or that they had moved at least three times in the last 12 months, dichotomized to 1 = students were experiencing housing insecurity and 0 = students were experiencing housing security. In the final matched pairs sample, 39.2% of students were experiencing housing insecurity.
Covariates
All the covariates were selected due to their associations with students’ basic needs insecurity or mental health (Broton, 2020; Broton & Goldrick-Rab, 2018; Goldrick-Rab et al., 2018, 2019; Nazmi et al., 2019; Soria & Horgos, 2021; The Hope Center for College, Community, and Justice, 2021; Vilme et al., 2022). The individual characteristic covariates included students’ gender, disability, race/ethnicity, sexual orientation, citizenship, and age (x̄ = 26.20, s = 9.56). I also included parents’ education, coded as 1 = parents have higher a bachelor’s degree or higher (continuing-generation students) and 0 = parents have less than a bachelor’s degree (first-generation students). Students reported whether they lived with a spouse or partner (1 = yes, 0 = no), were formerly in foster care (1 = yes, 0 = no), and whether they were a parent, primary caregiver, or guardian of any children (1 = yes, 0 = no). Students shared whether their family had trouble making ends meet financially when they were growing up (1 = yes, 0 = no) and how they paid for college (i.e., using Pell grants, student loans, a job, or with support from family/friends), coded 1 = yes, 0 = no. For the institutional/environmental variables, students reported their course load (1 = full-time [at least 12 credits], 0 = part-time [less than 12 credits]) and number of years they have been in college (x̄ = 3.16, s = 2.09). I also coded institutions based upon their region and type (1 = four-year, 0 = two-year) and students shared their COVID-19 experiences in 11 items (Table 1), coded 1 = yes, 0 = no.
I converted most of the demographic variables using effect coding except in the case of variables with dichotomous categories. I used effect coding to avoid positioning any one group as a normative comparison group. While dummy coding omits one group (the common referent group) from analysis of variables with more than two categories (e.g., gender), in effect coding the coefficients or odds ratios are interpreted relative to the average of the full sample and all groups are included in analyses (Ro & Bergom, 2020). With the dichotomous variables, each coefficient can be interpreted compared to the other level.
Data Analyses
I utilized propensity score matching techniques using the “MatchIt” package in R (Ho et al., 2021) to match students who did and did not experience food insecurity or housing insecurity using the covariates. I used binary logistic regression to compute individual propensity scores, the estimated probability that students experienced recent basic needs insecurity. Next, I used one-to-one nearest neighbor matching without replacement so that each student who had experienced recent basic needs insecurity was matched to a student who did not experience basic needs insecurity (Austin, 2011). I used a caliper of 0.10, which represents the maximum tolerated difference between matched pairs of students (Greifer, 2022a). A caliper of 0.20 is generally recommended because it can eliminate between 98% and 99% of the bias (Austin, 2009, 2011); however, tighter calipers may be useful when there is a stronger association between the matching variable and outcome variables (Raynor, 1983). In the present study, a caliper of 0.10 produced an overall better match than a caliper of 0.20; for instance, the 0.10 caliper reduced the standardized mean difference of the “distance” value (the difference between the propensity scores of students who did and did not experience basic needs insecurity) by over half (0.154 to 0.071) so that it fell under the recommended threshold of 0.10 (Figure 1; Greifer, 2022a). Using a 0.10 caliper also increased the percent balance improvement for all covariates (e.g., 93.8% for “family economics” compared to 84.3%).
It is important to assess the similarity of the covariate distributions (or balance) between the treatment and comparison groups after matching (Harder et al., 2010). Greifer (2022a) recommended reporting the standardized mean differences of the covariates before and after matching (i.e., in a Love plot) and the summaries of balance for other statistics when assessing balance. Therefore, I provided the standardized mean differences of the covariates in Figure 2 in addition to summaries of balance for the other statistics below.
Typically, a covariate is considered “balanced” if the standardized bias is less than 0.25 (Rubin, 2001). I reviewed the standardized mean differences in the covariates before and after matching and I detected no imbalances above 0.25 after matching (Figure 2; Austin, 2011; Harder et al., 2010; Rubin, 2001). The percent balance improvement for each covariate was above 0.00 and indicated the balance did not become worse after matching (Greifer, 2022a). The variance ratios of the propensity score and the covariates between the two groups after matching were within recommended ranges of 0.05 and 2.0 (Rubin, 2001). The empirical cumulative density functions (eCDF) statistics, which correspond to the difference in the overall distributions of the covariates between the groups, were closer to zero, which indicates better balance (Greifer, 2022a).
Figure 2. Love Plot of Absolute Standardized Mean Differences for Covariates Before and After Adjusting
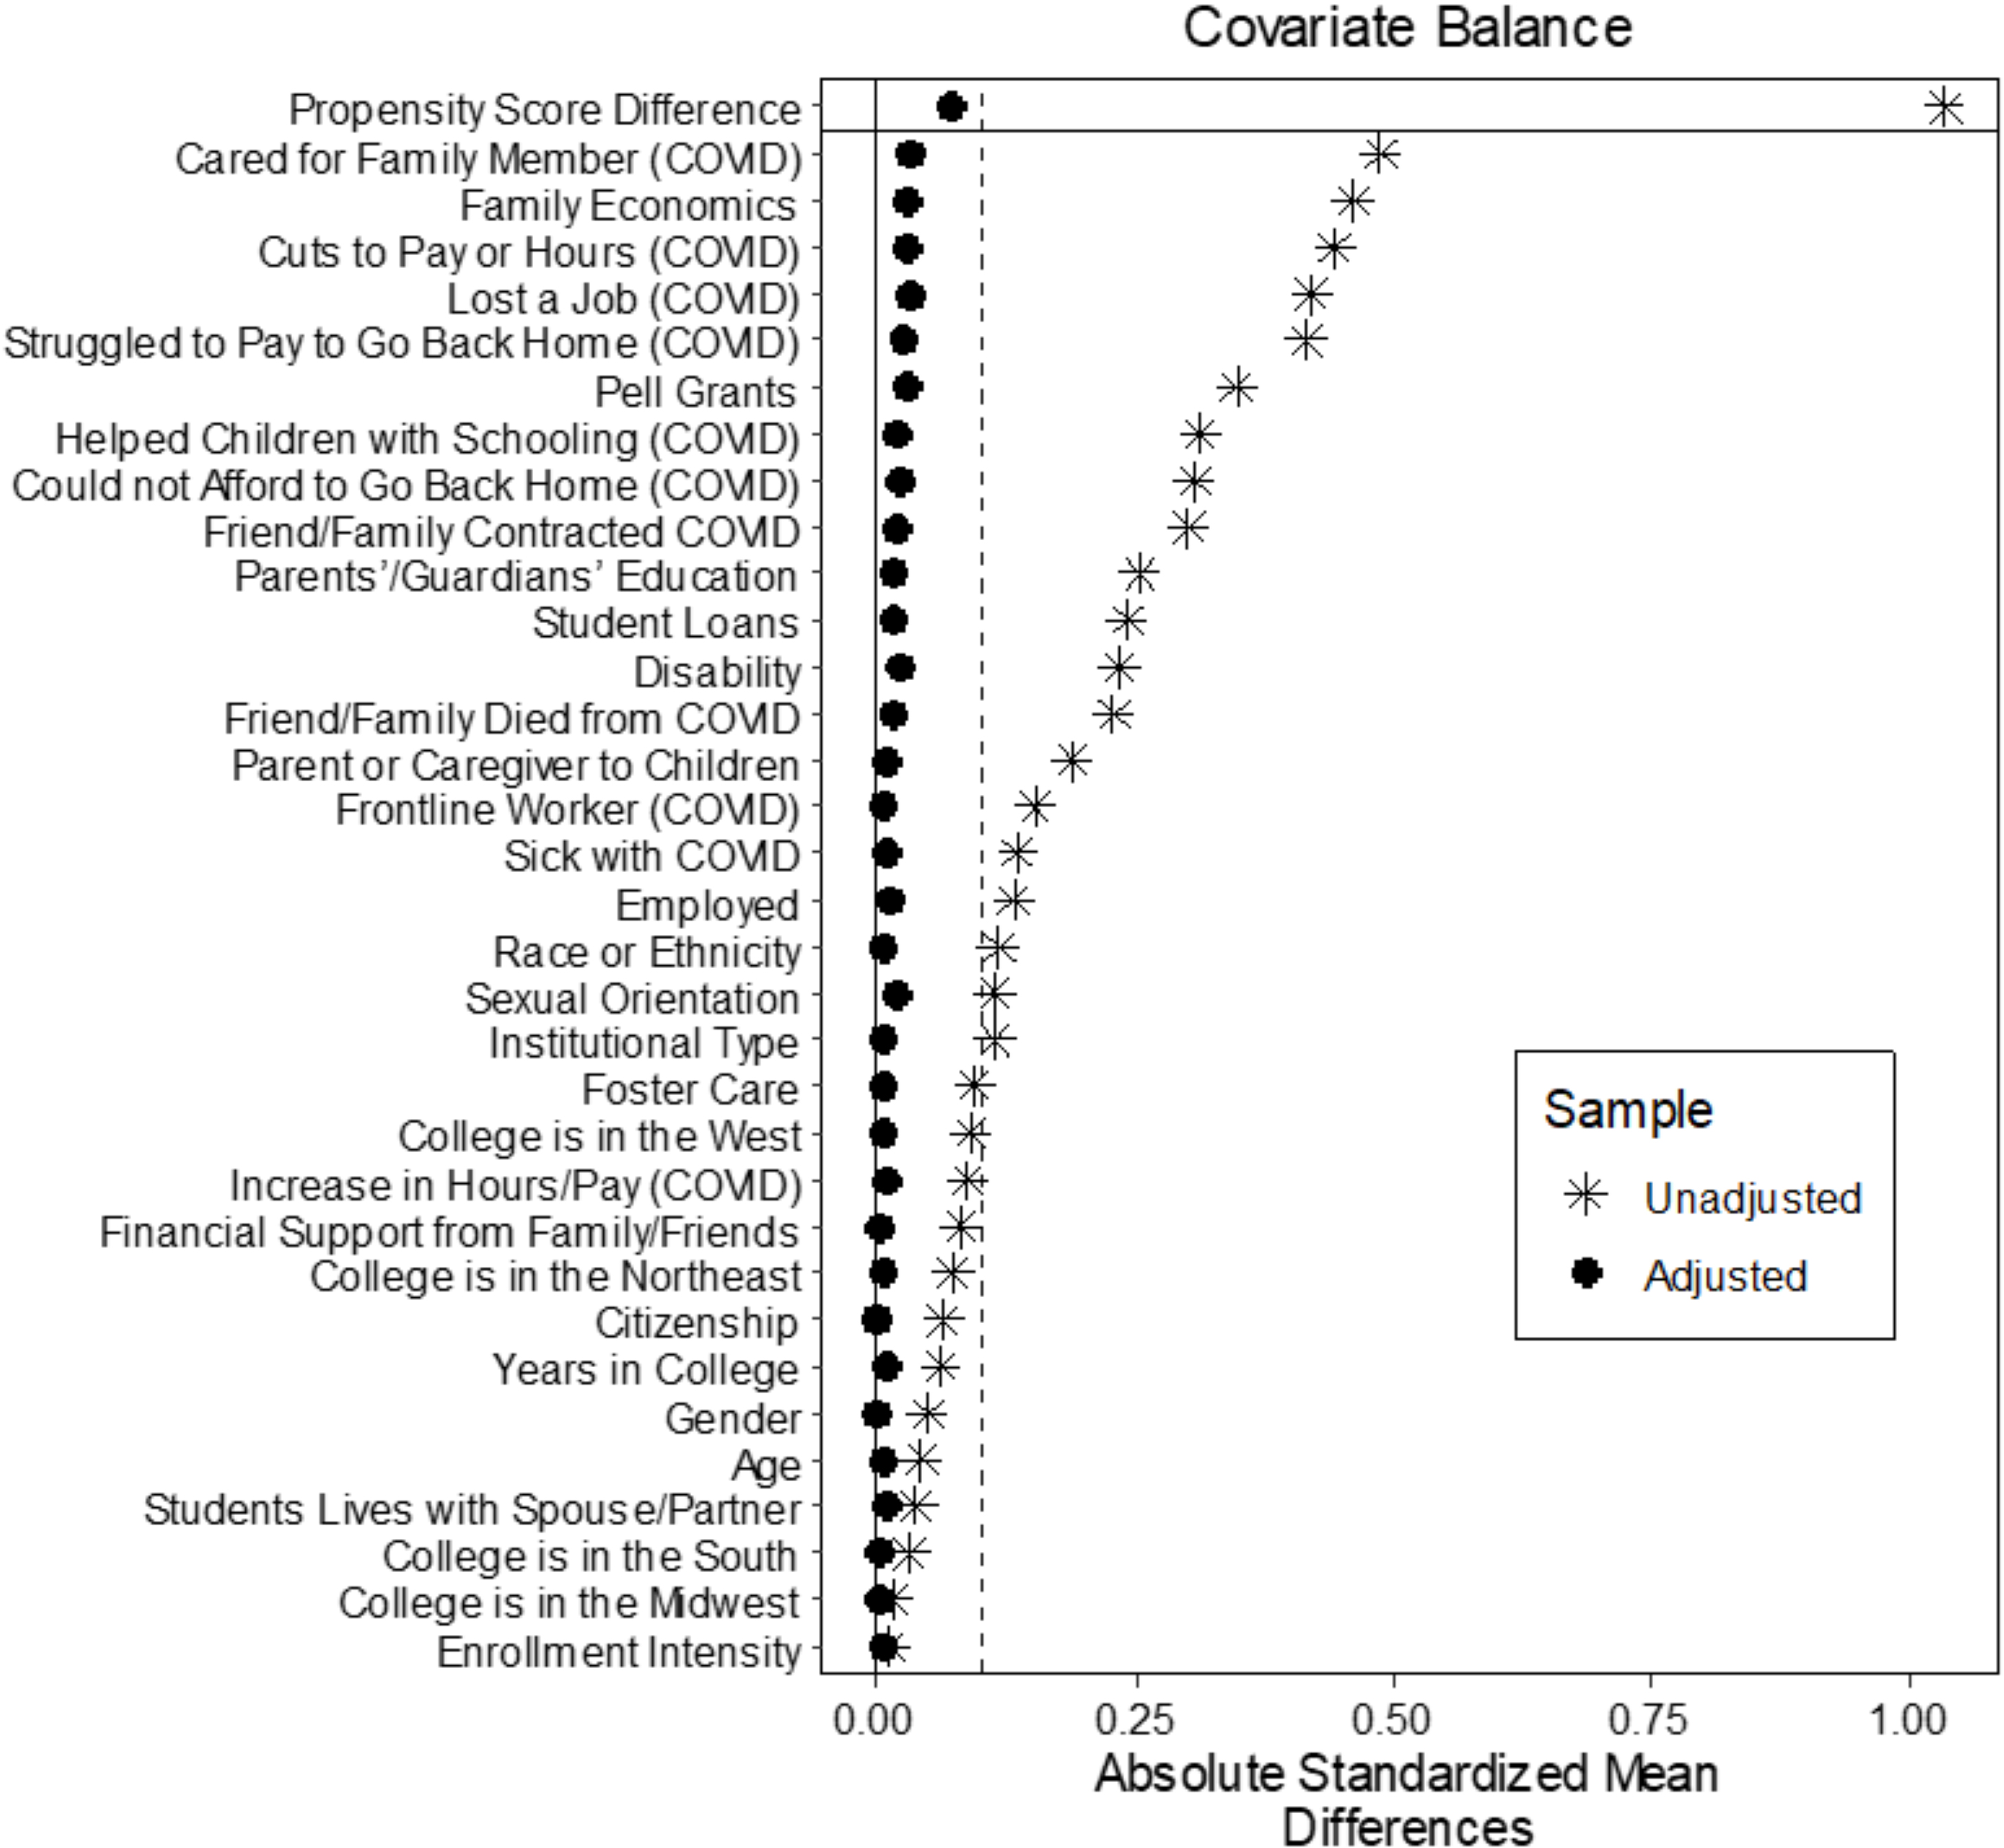
I visually inspected the Love plot of the standardized mean differences and observed that the matching improved balance on all covariates because they were all within a threshold of 0.10 (Figure 2; Greifer, 2022a). I next inspected the empirical quantile-quartile (eQQ) plots of the covariates for the treated units and value of the covariates at the corresponding quantile in the control group, kernel density plots of the covariate values and density of the sample at the covariate values, and the histograms of the density of propensity score distribution in the groups before and after matching. The visual evidence suggested that the covariates within the groups differed significantly before matching procedures and the matching techniques effectively decreased bias by making the groups of students who did and did not experience basic needs insecurity more similar with regard to the covariates.
After matching procedures, I used the matched pairs data set to examine the odds of experiencing clinically significant symptoms for MDD and GAD. For those analyses, I used multivariable logistic regression with the independent variables of food insecurity and housing insecurity and the dependent variables of experiencing clinically significant symptoms of moderate to severe MDD and GAD. I also included the same covariates used in matching procedures, a step that has several benefits including increasing precision in the estimates, reducing bias from residual imbalance, and generating more robust estimates (Greifer, 2022b, para. 9). Greifer recommended including the same covariates in the propensity score model in regressions for outcome variables unless there is a strong a priori and justifiable reason to exclude them.
I next analyzed the relationships between food and housing insecurity and students’ clinically significant symptoms of moderate to severe MDD and GAD in two separate logistic regression models. I ran additional diagnostics to assess the models. I used McKelvey and Zavoina’s (1975) pseudo-R2 value because it is one of the better estimates to evaluate the fit of binary models (Langer, 2016). The results were 0.217 for the MDD model and 0.184 for the GAD model. I used Hosmer et al.’s (2013) test to assess how well the data fits the model. Hosmer et al.’s test calculates whether the observed event rates match the expected event rates in subgroups. Due to the large sample size, I modified the number of groups based upon Paul et al.’s (2013) recommendation for a sample approaching, n = 50,000, g = 3,500. The results from each model suggest the models seemed to fit well (MDD: χ2 = 3480.394, df = 3,498, p = 0.580; GAD: χ2 = 3553.292, df = 3,498, p = 0.253). I examined the variables for multicollinearity and discovered that none of the variance inflation factors (VIF) had values above 5.0, suggesting multicollinearity was not a problem in the models (Field et al., 2012). I computed marginal effects, which presents results as a difference in probabilities (Austin, 2011).
Results
The results of the first logistic regression suggest that very low and low food security increases the probability of MDD symptoms by 9.5 and 1.7 percentage points, respectively (Table 3). Marginal and high food security reduces the probability of MDD symptoms by 3.7 and 8.0 percentage points, respectively. Housing insecurity increases the probability of MDD symptoms by 4.4 percentage points. There are several additional groups of students who have an increased probability of experiencing clinically significant MDD symptoms compared to their peers, including students with psychological disorders or multiple disabilities, nonbinary or transgender students, bisexual students and students who prefer to self-describe their sexual orientation, students whose family had difficulty making ends meet growing up, first-generation students, students enrolled in two-year colleges, Southeast Asian students, other (non-Southeast) Asian or Asian American students, and Middle Eastern, North African, Arab, or Arab American students. Several COVID-19 related experiences were also associated with an increased probability of MDD symptoms (e.g., experiencing cuts to hours/pay and experiencing a close friend/family member who was either sick or passed away from COVID-19). There were additional observations related to age, years in college, location of the college, finances, citizenship, caregiving status, and other variables (Table 2).
Table 2. Results of the Logistic Regression for Major Depressive Disorder (MDD)
|
Average Marginal Effects (AME) |
95% CI (AME) |
Standard Error |
p |
|
|---|---|---|---|---|
|
Basic Needs Insecurity |
||||
|
Very low food security |
0.095 |
0.087, 0.104 |
0.005 |
*** |
|
Low food security |
0.017 |
0.008, 0.026 |
0.005 |
*** |
|
Marginal security |
−0.037 |
−0.045, −0.029 |
0.004 |
*** |
|
High food security |
−0.080 |
−0.086, −0.074 |
0.003 |
*** |
|
Housing insecurity |
0.044 |
0.036, 0.056 |
0.004 |
*** |
|
Individual Characteristics |
||||
|
Chronic illness |
−0.043 |
−0.060, −0.026 |
0.009 |
*** |
|
Cognitive, learning, or neurological disorder or disability |
−0.057 |
−0.077, −0.038 |
0.010 |
*** |
|
Other disability or medical condition |
−0.041 |
−0.079, −0.003 |
0.019 |
* |
|
Physical disability |
−0.047 |
−0.081, −0.014 |
0.017 |
** |
|
Psychological disorder |
0.132 |
0.120, 0.143 |
0.006 |
*** |
|
Multiple disabilities |
0.129 |
0.117, 0.141 |
0.006 |
*** |
|
No disability or medical condition |
−0.072 |
−0.083, −0.062 |
0.005 |
*** |
|
Women |
−0.023 |
−0.040, −0.009 |
0.007 |
*** |
|
Men |
−0.030 |
−0.044, −0.016 |
0.007 |
*** |
|
Nonbinary |
0.036 |
0.006, 0.067 |
0.016 |
* |
|
Transgender |
0.032 |
0.003, 0.060 |
0.015 |
* |
|
Prefer to self-describe or not to provide gender |
−0.015 |
−0.046, 0.016 |
0.016 |
|
|
Black or African American |
−0.032 |
−0.050, −0.015 |
0.009 |
** |
|
Middle Eastern, North African, Arab, or Arab American |
0.058 |
0.019, 0.098 |
0.020 |
** |
|
Southeast Asian |
0.022 |
0.001, 0.043 |
0.011 |
* |
|
American Indian or Native American |
−0.087 |
−0.147, −0.027 |
0.031 |
** |
|
Hispanic, Latinx, or Chicanx |
−0.003 |
−0.0190, 0.012 |
0.008 |
|
|
Pacific Islander or Native Hawaiian |
−0.012 |
−0.089, 0.064 |
0.039 |
|
|
Other (non-Southeast) Asian or Asian American |
0.032 |
0.005, 0.060 |
0.014 |
* |
|
White |
−0.003 |
−0.017, 0.011 |
0.007 |
|
|
Multiracial |
0.009 |
−0.007, 0.024 |
0.008 |
|
|
No race/ethnicity provided |
0.016 |
−0.012, 0.043 |
0.014 |
|
|
Heterosexual or straight |
−0.065 |
−0.074, −0.057 |
0.004 |
*** |
|
Gay or lesbian |
||||
|
Bisexual |
0.047 |
0.035, 0.058 |
0.006 |
*** |
|
Prefer to self-describe sexual orientation |
0.033 |
0.014, 0.051 |
0.010 |
*** |
|
Prefer not to answer sexual orientation |
−0.022 |
−0.038, −0.006 |
0.008 |
* |
|
Family had trouble making ends meet financially growing up |
0.062 |
0.054, 0.070 |
0.004 |
*** |
|
Continuing generation (parents have ≥ a bachelor’s degree) |
−0.013 |
−0.005, −0.021 |
0.004 |
*** |
|
Student lives with a spouse or partner |
−0.032 |
−0.042, −0.021 |
0.005 |
*** |
|
Student was formerly in foster care |
−0.048 |
−0.078 −0.018 |
0.015 |
** |
|
U.S. citizen or permanent resident |
0.027 |
0.005, 0.048 |
0.011 |
* |
|
Student is a parent, guardian, or caregiver to children |
−0.103 |
−0.118, −0.087 |
0.008 |
*** |
|
Age |
−0.005 |
−0.006, −0.005 |
0.000 |
*** |
|
Uses Pell grants to pay for college |
−0.020 |
−0.028, −0.011 |
0.005 |
*** |
|
Uses student loans to pay for college |
−0.001 |
−0.010, 0.008 |
0.005 |
|
|
Has a job (to pay for college) |
−0.001 |
−0.011, 0.008 |
0.005 |
|
|
Pays for college with support from family/friends |
0.011 |
0.0028, 0.0197 |
0.004 |
** |
|
Environmental and Institutional Variables |
||||
|
Full-time enrollment |
0.008 |
−0.001, 0.017 |
0.005 |
|
|
Enrolled in a two-year college |
0.003 |
−0.006, 0.013 |
0.005 |
|
|
Years enrolled in college |
0.002 |
0.001, 0.005 |
0.001 |
* |
|
College is in the Midwest |
0.004 |
−0.010, 0.018 |
0.007 |
|
|
College is in the South |
0.019 |
0.007, 0.031 |
0.006 |
*** |
|
College is in the Northeast |
−0.004 |
−0.019, 0.010 |
0.007 |
|
|
College is in the West |
0.023 |
0.011, 0.035 |
0.006 |
*** |
|
COVID-19 Experiences |
||||
|
Had to take care of a family member while attending class |
0.072 |
0.063, 0.081 |
0.005 |
*** |
|
Had to help children in the home with their schooling while attending classes |
0.013 |
0.002, 0.024 |
0.006 |
* |
|
Lost a job |
0.022 |
0.012, 0.031 |
0.005 |
** |
|
Struggled to pay to go back home |
0.018 |
−0.003, 0.039 |
0.011 |
|
|
Could not afford to go back home |
0.012 |
0.002, 0.022 |
0.005 |
*** |
|
Experienced cuts to hours or pay at work |
0.010 |
0.001, 0.019 |
0.005 |
* |
|
Experienced an increase in hours or pay at work |
0.015 |
0.004, 0.026 |
0.006 |
|
|
Worked as a frontline worker supporting COVID |
0.001 |
−0.013, 0.015 |
0.007 |
|
|
Was sick with COVID |
−0.005 |
−0.023, 0.012 |
0.009 |
|
|
A close friend or family member was sick with COVID |
0.029 |
0.019, 0.037 |
0.005 |
*** |
|
A close friend or family member died of COVID |
0.023 |
0.008, 0.037 |
0.007 |
** |
Note. *p < .05, **p < .01, ***p < .001; effect coding was used for most demographic variables.
The results of the logistic regression for GAD symptoms suggest that very low and low food security increases the probability of GAD symptoms by 9.8 and 1.7 percentage points, respectively (Table 3). Marginal and high food security reduces the probability of GAD symptoms by 2.8 and 8.7 percentage points, respectively. Housing insecurity increases the probability of GAD symptoms by 4.0 percentage points. There are several additional groups of students who have an increased probability of experiencing clinically significant GAD symptoms compared to their peers, including students with psychological disorders or multiple disabilities, bisexual students and students who prefer to self-describe their sexual orientation, students whose family had difficulty making ends meet growing up, first-generation students, full-time students, White students, and Middle Eastern, North African, Arab, or Arab American students. Several COVID-19 related experiences were also associated with increased probability of clinically significant GAD symptoms (e.g., losing a job, experiencing cuts to hours/pay, and experiencing a close friend/family member who was either sick or passed away from COVID). There were additional observations related to age, years in college, location of the college, finances, and other variables.
Table 3. Results of the Logistic Regression for Generalized Anxiety Disorder (GAD)
|
Average Marginal Effects (AME) |
95% CI (AME) |
Standard Error |
p |
|
|---|---|---|---|---|
|
Basic Needs Insecurity |
||||
|
Very low food security |
0.098 |
0.089, 0.106 |
0.005 |
*** |
|
Low food security |
0.017 |
0.008, 0.026 |
0.005 |
*** |
|
Marginal security |
−0.037 |
−0.045, −0.029 |
0.003 |
*** |
|
High food security |
−0.087 |
−0.093, −0.081 |
0.003 |
*** |
|
Housing insecurity |
0.040 |
0.032, 0.048 |
0.004 |
*** |
|
Individual Characteristics |
||||
|
Chronic illness |
−0.045 |
−0.062, −0.028 |
0.009 |
*** |
|
Cognitive, learning, or neurological disorder or disability |
−0.064 |
−0.084, −0.045 |
0.010 |
*** |
|
Other disability or medical condition |
−0.048 |
−0.085, −0.011 |
0.019 |
* |
|
Physical disability |
−0.065 |
−0.099, −0.032 |
0.017 |
*** |
|
Psychological disorder |
0.160 |
0.149, 0.172 |
0.006 |
*** |
|
Multiple disabilities |
0.148 |
0.137, 0.160 |
0.006 |
*** |
|
No disability or medical condition |
−0.086 |
−0.097, −0.076 |
0.005 |
*** |
|
Women |
0.001 |
−0.012, 0.014 |
0.007 |
|
|
Men |
−0.068 |
−0.082, −0.054 |
0.007 |
*** |
|
Nonbinary |
0.027 |
−0.003, 0.057 |
0.015 |
|
|
Transgender |
0.027 |
−0.001, 0.054 |
0.014 |
|
|
Prefer to self-describe or not to provide gender |
0.013 |
−0.018, 0.041 |
0.016 |
|
|
Black or African American |
−0.065 |
−0.082, −0.047 |
0.009 |
*** |
|
Middle Eastern, North African, Arab, or Arab American |
0.076 |
0.037, 0.114 |
0.020 |
*** |
|
Southeast Asian |
0.008 |
−0.020, 0.035 |
0.014 |
|
|
American Indian or Native American |
−0.065 |
−0.132, −0.026 |
0.030 |
* |
|
Hispanic, Latinx, or Chicanx |
−0.006 |
−0.022, 0.009 |
0.008 |
|
|
Pacific Islander or Native Hawaiian |
0.028 |
−0.046, 0.101 |
0.038 |
|
|
Other (non-Southeast) Asian or Asian American |
0.003 |
−0.018, 0.025 |
0.011 |
|
|
White |
0.018 |
0.004, 0.031 |
0.007 |
* |
|
Multiracial |
0.010 |
−0.006, 0.025 |
0.008 |
|
|
No race/ethnicity provided |
0.002 |
−0.025, 0.029 |
0.014 |
|
|
Heterosexual or straight |
−0.051 |
−0.059, −0.042 |
0.004 |
*** |
|
Gay or lesbian |
0.008 |
−0.008, 0.024 |
0.008 |
|
|
Bisexual |
0.039 |
−0.028, 0.051 |
0.006 |
*** |
|
Prefer to self-describe sexual orientation |
0.028 |
0.009, 0.046 |
0.009 |
** |
|
Prefer not to answer sexual orientation |
−0.024 |
−0.041, −0.009 |
0.008 |
** |
|
Family had trouble making ends meet financially growing up |
0.068 |
0.060, 0.076 |
0.004 |
*** |
|
Continuing generation (parents have ≥ a bachelor’s degree) |
−0.011 |
−0.002, −0.019 |
0.004 |
** |
|
Student lives with a spouse or partner |
−0.002 |
−0.012, 0.008 |
0.005 |
|
|
Student was formerly in foster care |
−0.057 |
−0.087, −0.027 |
0.015 |
** |
|
U.S. citizen or permanent resident |
0.030 |
0.007, 0.051 |
0.009 |
** |
|
Student is a parent, guardian, or caregiver to children |
−0.072 |
−0.087, −0.057 |
0.008 |
*** |
|
Age |
−0.005 |
−0.006, −0.005 |
0.001 |
*** |
|
Uses Pell grants to pay for college |
−0.029 |
−0.038, −0.021 |
0.004 |
*** |
|
Uses student loans to pay for college |
0.005 |
−0.004, 0.014 |
0.005 |
|
|
Has a job (to pay for college) |
−0.004 |
−0.013, 0.006 |
0.005 |
|
|
Pays for college with support from family/friends |
0.017 |
0.009, 0.026 |
0.004 |
*** |
|
Environmental and Institutional Variables |
||||
|
Full-time enrollment |
0.013 |
0.004, 0.022 |
0.005 |
** |
|
Enrolled in a two-year college |
−0.011 |
−0.020, −0.001 |
0.050 |
* |
|
Years enrolled in college |
0.006 |
0.004, 0.008 |
0.001 |
*** |
|
College is in the Midwest |
0.006 |
−0.008, 0.020 |
0.007 |
|
|
College is in the South |
0.017 |
0.005, 0.030 |
0.006 |
** |
|
College is in the Northeast |
−0.006 |
−0.020, 0.008 |
0.007 |
|
|
College is in the West |
0.014 |
0.002, 0.027 |
0.006 |
* |
|
COVID-19 Experiences |
||||
|
Had to take care of a family member while attending class |
0.075 |
0.006, 0.084 |
0.005 |
*** |
|
Had to help children in the home with their schooling while attending classes |
0.002 |
−0.009, 0.013 |
0.006 |
|
|
Lost a job |
0.019 |
0.010, 0.028 |
0.005 |
*** |
|
Struggled to pay to go back home |
−0.001 |
−0.021, 0.020 |
0.011 |
|
|
Could not afford to go back home |
0.018 |
0.004, 0.032 |
0.007 |
*** |
|
Experienced cuts to hours or pay at work |
0.018 |
0.009, 0.027 |
0.005 |
*** |
|
Experienced an increase in hours or pay at work |
0.007 |
−0.005, 0.019 |
0.006 |
|
|
Worked as a frontline worker supporting COVID |
−0.002 |
−0.014, 0.011 |
0.007 |
|
|
Was sick with COVID |
−0.023 |
−0.041, −0.006 |
0.009 |
|
|
A close friend or family member was sick with COVID |
0.032 |
0.023, 0.041 |
0.004 |
*** |
|
A close friend or family member died of COVID |
0.031 |
0.017, 0.045 |
0.007 |
*** |
Note. *p < .05, **p < .01, ***p < .001; effect coding was used for most demographic variables.
Limitations
The present study is cross-sectional in nature and students’ survey responses were collected near the beginning of the pandemic in fall 2020; as a result, the limited snapshot of students’ experiences with basic needs insecurity may not reflect changes as the pandemic progressed. Although the study has a large sample, the response rates in the individual campuses were low and there was item response attrition as students progressed through the survey, factors that could increase response bias (Fosnacht et al., 2017). It is also not possible to determine the representativeness of the sample compared to those who were administered the survey. The degree to which food insecurity overlaps with housing insecurity may have influenced the outcomes and the effect sizes are small for most of the independent variables (Chen et al., 2010), which means that there are other variables that may better be associated with the outcomes. Additionally, the diagnostic tools used to measure MDD and GAD symptoms require follow-up consultation for diagnosis, so the results should not be interpreted as definitive rates of MDD or GAD among students.
Furthermore, matching methods using propensity scores present a variety of limitations; for instance, the selection of covariates in the initial logistic regression is subjective and misspecification of the initial logistic model is common (King & Nielsen, 2016). Propensity score matching reduces the sample size for the outcome analysis, introducing potential bias in the final model (Peikes et al., 2008). The procedures also cannot account for unmeasured covariates that may be related to basic needs insecurity or mental health. While propensity score matching techniques are relatively robust methods for reducing bias from the imbalances in observed covariates (Rubin, 1973), these techniques are not meant to reproduce experimental randomized control trials and the results should therefore be interpreted with caution.
Discussion and Recommendations
Even before the COVID-19 pandemic, the rates at which college students experienced MDD and GAD were steadily increasing, signaling to many an emerging mental health “crisis” on college campuses (Kadison & DiGeronimo, 2005; Schwartz & Kay, 2009). The stressors associated with the COVID-19 pandemic may have elevated the rates of MDD and GAD symptoms among college students, so it is more important than ever to understand the factors that may place some students at risk of experiencing MDD and GAD symptoms. After matching students using individual, institutional, financial, and COVID-19-related variables identified within the conceptual framework (Fink, 2014; Glover et al., 2020), the results of this study suggest that there are small, positive, and significant relationships between food and housing insecurity and students’ clinically significant symptoms of moderate to severe MDD and moderate to severe GAD.
Although the overall potential relationships between students’ basic needs insecurity and MDD/GAD symptoms are small and therefore suggest there may be other exogenous variables more strongly associated with students’ mental health, the results of the study confirm what other researchers have discovered regarding the relationships between basic needs insecurity and college students’ mental health (Martinez et al., 2020; Soria & Horgos, 2021; Soria, Kelling, et al., 2022) while adding value to the existing research with an expanded sample of students at both two-year and four-year colleges and different analytical approaches. Further, the results of this study advance the use of a traditional conceptual framework related to students’ mental health (Fink, 2014) while incorporating exogenous factors associated with the COVID-19 pandemic (Glover et al., 2020). As demonstrated, students’ experiences during the pandemic—especially their financial-related experiences—were associated with elevated rates of clinically significant MDD and GAD symptoms. Those financial experiences (e.g., losing jobs, experiencing cuts to hours/wages), in turn, could have exacerbated students’ rates of basic needs insecurity. After accounting for the covariates identified in the conceptual framework that may predict students’ basic needs insecurity and mental health and decreasing potential bias from covariates through matching procedures, the results of this study provide an estimate of the relationships between food and housing insecurity and students’ mental health.
Against the backdrop of these results, there are several steps higher education and student affairs practitioners can take to support college students’ mental health and basic needs insecurity. For one, there should be coordinated collaborations between counseling centers and basic needs insecurity resource centers. When assessing the needs of students, mental health practitioners may find it useful to administer assessments of food and housing insecurity or ask students about their experiences with food and housing insecurity in counseling sessions (Coakley et al., 2022). It may be useful to promote mental health and counseling services within services or centers designed to support students who may experience basic needs insecurity (e.g., food pantries, off-campus housing services), engage in cross-promotion of services using websites or social media, or embed services within both spaces (e.g., adding a smaller food pantry in the counseling center, offering walk-in counseling sessions near a food pantry).
Cross-campus collaborations to establish a “single point of contact” resource center for students can ensure that students are better supported with wraparound services (Broton, 2021; Crutchfield et al., 2020; Nix et al., 2021). Many students have difficulty locating campus support services, are unsure if they are eligible for services, and are hesitant to ask for help when needed (Umaña et al., 2022). It can be challenging for students experiencing basic needs insecurity to navigate complex institutional and governmental support systems, thus potentially elevating students’ levels of stress and exacerbating poor mental health symptoms (Broton, 2021; Mulrenan et al., 2018; Soria & Horgos, 2021). A single point of contact resource center for students can reduce the complexity of navigating complex systems. Such a resource center, coupled with text-based nudging that informs eligible students about the availability of resources using stigma-reducing and empowering messages, can also support students’ use of campus resources and services (Umaña et al., 2022).
Higher education and student affairs practitioners may wish to proactively reach out to students who are likely to experience an increased risk of both basic needs insecurity and higher rates of clinically significant MDD or GAD symptoms. As demonstrated in this study and supported by prior research, such students may include those from low-income backgrounds, students with minoritized sexual orientation or gender identities (e.g., transgender students, bisexual students), students with psychological disabilities or multiple disabilities, or first-generation college students (Goldrick-Rab et al., 2018, 2019; Haskett et al., 2020; Liu et al., 2022; Soria, Kelling, et al., 2022). Those students may also experience marginalization from campus-based mental health care systems, resources, and support, and experience significantly more barriers to accessing campus counseling centers (Liu et al., 2022; Stebleton et al., 2014; Soria, Kelling, et al., 2022), so they may likely benefit from coordinated outreach efforts that cross-promote the availability of mental health and basic needs resources.
Higher education and student affairs practitioners may benefit from professional development opportunities to learn about basic needs support services available to students; for instance, students may be eligible to receive support from governmental assistance programs including Supplemental Nutrition Assistance Program (SNAP); the Special Supplemental Assistance Program for Women, Infants and Children (WIC); or the Temporary Assistance for Needy Families (TANF) program. Practitioners should also be aware of—and actively promote—on- and off-campus housing resources for students, including shelters or emergency housing facilities, local or state governmental housing assistance (e.g., for rental assistance), emergency housing grants, and free legal services that can support students experiencing challenges with breaking leases or disputes with landlords. Administrators and faculty can also work in concert with student affairs practitioners, residence life staff, or off-campus housing liaisons to advocate for increases in the number of low-cost, free, and emergency housing spaces that are available on-campus (e.g., in residence halls) or off-campus (e.g., in nearby hotels).
Finally, higher education and student affairs practitioners can be a powerful force in lobbying for local, state, and federal legislation to support students’ basic needs insecurity. For instance, Senate Bill 5738 (2019) was introduced in Washington to require four-year colleges and universities to plan for the unique needs and challenges of students experiencing homelessness. The bill required that institutions develop a capital plan to renovate an existing campus building to include laundry facilities, storage units, showers, and lockers; provide free or reduced-price meals if the institution offers a culinary program; and engage with local housing authorities to provide tenant-based rental assistance programs. While some of the policies enacted during the COVID-19 pandemic may have exacerbated disparities among students who were already marginalized before the pandemic (Glover et al., 2020), new policies and legislation can be developed to mitigate future harms and better support students who struggle in meeting their basic needs.
Conclusion
The prevalence of college students’ mental health disorders and basic needs insecurity during the COVID-19 pandemic is concerning and has far-reaching implications for student affairs and mental health practitioners on a variety of college and university campuses. Armed with a deeper understanding of the relationships between food and housing insecurity and students’ symptoms of MDD and GAD, higher education and student affairs practitioners can incorporate information about basic needs insecurity services, resources, and programs into their practices. Practitioners can also integrate mental health and basic needs services on campus and work alongside other campus professionals, including faculty and administrators, to advocate for the expansion of services and policies to alleviate college students’ food and housing insecurity.
References
Anderson, S. A. (1990). Core indicators of nutritional state for difficult-to-sample populations. The Journal of Nutrition, 120(11), 1557–1599. https://doi.org/10.1093/jn/120.suppl_11.1555
Austin, P. C. (2009). Some methods of propensity-score matching had superior performance to others: Results of an empirical investigation of Monte Carlo simulations. Biometrical Journal, 51(1), 171–184. https://doi.org/10.1002/bimj.200810488
Austin, P. C. (2011). An introduction to propensity score methods for reducing the effects of confounding in observational studies. Multivariate Behavioral Research, 46(3), 399–424. https://doi.org/10.1080/00273171.2011.568786
Benham, G. (2020). Stress and sleep in college students prior to and during the COVID-19 pandemic. Stress and Health, 37(3), 504–515. https://doi.org/10.1002/smi.3016
Betancourt, N., & Wolff-Eisenberg, C. (2019). Surveying community college students: Strategies for maximizing engagement and increasing participation. Ithaka S+R.
Birmingham, W. C., Wadsworth, L. L., Lassetter, J. H., Graff, T. C., Lauren, E., & Hung, M. (2021). COVID-19 lockdown: Impact on college students’ lives. Journal of American College Health. Advance online publication. https://doi.org/10.1080/07448481.2021.1909041
Broton, K. M. (2020). A review of estimates of housing insecurity and homelessness among students in U.S. higher education. Journal of Social Distress and Homelessness, 29(1), 25–38. https://doi.org/10.1080/10530789.2020.1677009
Broton, K. M. (2021). Poverty in American higher education: The relationship between housing insecurity and academic attainment. Journal of Postsecondary Student Success, 1(2), 18–45. https://doi.org/10.33009/fsop_jpss129147
Broton, K. M., & Goldrick-Rab, S. (2018). Going without: An exploration of food and housing insecurity among undergraduates. Educational Researcher, 47(2), 121–133. https://doi.org/10.3102/0013189X17741303
California Student Aid Commission. (2020). COVID-19 student survey. https://www.csac.ca.gov/sites/main/files/file-attachments/2020_covid19_student_survey.pdf?1594172054
Cameron, M., Lacy, T. A., Siegel, P., Wu, J., Wilson, A., Johnson, R., Burns, R., & Wine, J. (2021). 2019–2020 National Postsecondary Student Aid Study (NPSAS: 20): First look at the impact of the coronavirus (COVID-19) pandemic on undergraduate student enrollment, housing, and finances. U.S. Department of Education.
Charles, N. E., Strong, S. J., Burns, L. C., Bullerjahn, M. R., & Serafine, K. M. (2021). Increased mood disorder symptoms, perceived stress, and alcohol use among college students during the COVID-19 pandemic. Psychiatry Research, 296, 113706. https://doi.org/10.1016/j.psychres.2021.113706
Chen, H., Cohen, P., & Chen, S. (2010). How big is a big odds ratio? Interpreting the magnitudes of odds ratios in epidemiological studies. Communications in Statistics—Simulation and Computation, 39(4), 860–864. https://doi.org/10.1080/03610911003650383
Clabaugh, A., Duque, J. F., & Fields, L. J. (2021). Academic stress and emotional well-being in United States college students following onset of the COVID-19 pandemic. Frontiers in Psychology, 12, 628787. https://doi.org/10.3389/fpsyg.2021.628787
Coakley, K. E., Cargas, S., Walsh-Dilley, M., & Mechler, H. (2022). Basic needs insecurities are associated with anxiety, depression, and poor health among university students in the State of New Mexico. Journal of Community Health, 47, 454–463. https://doi.org/10.1007/s10900-022-01073-9
Coleman-Jensen, A., Rabbitt, M. P., Gregory, C. A., & Singh, A. (2020). Household food insecurity in the United States in 2020. U.S. Department of Agriculture Economic Research Service.
Collier, D. A., Fitzpatrick, D., Brehm, C., & Archer, E. (2021). Coming to college hungry: How food insecurity relates to amotivation, stress, engagement, and first-semester performance in a four-year university. Journal of Postsecondary Student Success, 1(1), 106–135. https://doi.org/10.33009/fsop_jpss124641
Copeland, W. E., McGinnis, E., Bai, Y., Adams, Z., Nardone, H., Devadanam, V., Rettew, J., & Hudziak, J. J. (2021). The impact of COVID-19 pandemic on college student mental health and wellness. Journal of the American Academy of Child & Adolescent Psychiatry, 60(1), 134–141. https://doi.org/10.1016/j.jaac.2020.08.466
Crutchfield, R. M., Chambers, R. M., Carpena, A., & McCloyn, T. N. (2020). Getting help: An exploration of student experiences with a campus program addressing basic needs insecurity. Journal of Social Distress and Homelessness, 29(1), 16–24. https://doi.org/10.1080/10530789.2020.1677010
Field, A., Miles, J., & Field, Z. (2012). Discovering statistics using R. Sage.
Fink, J. E. (2014). Flourishing: Exploring predictors of mental health within the college environment. Journal of American College Health, 62(6), 380–388. https://doi.org/10.1080/07448481.2014.917647
Fosnacht, K., Sarraf, S., Howe, E., & Peck, L. K. (2017). How important are high response rates for college surveys? The Review of Higher Education, 40(2), 245–265. https://doi.org/10.1353/rhe.2017.0003
Fruehwirth, J. C., Biswas S., & Perreira, K. M. (2021). The Covid-19 pandemic and mental health of first-year college students: Examining the effect of Covid-19 stressors using longitudinal data. PLoS ONE, 16(3), e0247999. https://doi.org/10.1371/journal.pone.0247999
Glover, R. E., van Schalkwyk, M. C. I., Akl, E. A., Kristjannson, E., Lotfi, T., Petkovic, J., Petticrew, M. P., Pottie, K., Tugwell, P., & Welch, V. (2020). A framework for identifying and mitigating the equity harms of COVID-19 policy interventions. Journal of Clinical Epidemiology, 128, 35–48. https://doi.org/10.1016/j.jclinepi.2020.06.004
Goldrick-Rab, S., Baker-Smith, C., Coca, V., Looker, E., & Williams, T. (2019). College and university basic needs insecurity: A national #RealCollege survey report. The Hope Center for College, Community, and Justice.
Goldrick-Rab, S., Richardson, J., Schneider, J., Hernandez, A., & Cady, C. (2018). Still hungry and homeless in college. The Hope Center for College, Community, and Justice.
Greifer, N. (2022a). Assessing balance. https://cran.rproject.org/web/packages/MatchIt/vignettes/assessing-balance.html
Greifer, N. (2022b). Estimating effects after matching. https://cran.rproject.org/web/packages/MatchIt/vignettes/estimating-effects.html
Harder, V. S., Stuart, E. S., & Anthony, J. C. (2010). Propensity score techniques and the assessment of measured covariate balance to test causal associations in psychological research. Psychological Methods, 15(3), 234–249. https://doi.org/10.1037/a0019623
Haskett, M. E., Kotter-Grühn, D., & Majumder, S. (2020). Prevalence and correlates of food insecurity and homelessness among university students. Journal of College Student Development, 56(1), 109–114. http://doi.org/10.1353/csd.2020.0007
Ho, D., Imai, K., King, G., Stuart, E., Whitworth, A., & Greifer, N. (2021). Package “MatchIt.” https://cran.r-project.org/web/packages/MatchIt/MatchIt.pdf
Hosmer, D. W., Lemeshow, S., & Sturdivant, R. X. (2013). Applied logistic regression (3rd ed.). Wiley.
Kadison, R., & DiGeronimo, T. F. (2005). College of the overwhelmed: The campus mental health crisis and what to do about it. Wiley.
Kim, H., Rackoff, G. N., Fitzsimmons-Craft, E. E., Shin, K. E., Zainal, N. H., Schwob, J. T., Eisenberg, D., Wilfley, D. E., Taylor, C. B., & Newman, M. G. (2021). College mental health before and during the COVID-19 pandemic: Results from a nationwide survey. Cognitive Therapy and Research. Advance online publication. https://doi.org/10.1007/s10608-021-10241-5
King, G., & Nielsen, R. (2016). Why propensity scores should not be used for matching. Political Analysis, 27(4), 435–454. https://doi.org/10.1017/pan.2019.11
Kroenke, K., Spitzer, R. L., & Williams, J. B. W. (2001). The PHQ-9: Validity of a brief depression severity measure. Journal of General Internal Medicine, 16(9), 606–613. https://doi.org/10.1046/j.1525-1497.2001.016009606.x
Langer, W. (2016). The assessment of fit in the class of logistic regression models: A pathway out of the jungle of pseudo-R2s with an extension to multinomial logit models. Université du Luxembourg.
Leung, C. W., Farooqui, S., Wolfson, J. A., & Cohen, A. J. (2021). Understanding the cumulative burden of basic needs insecurities: Associations with health and academic achievement among college students. American Journal of Health Promotion, 35(2), 275–278. https://doi.org/10.1177/0890117120946210
Little, R. J. A. (1988). A test of missing completely at random for multivariate data with missing values. Journal of the American Statistical Association, 83(404), 1198–1202.
Liu, C. H., Pinder-Amaker, S., Hahm, H. C., & Chen, J. A. (2022). Priorities for addressing the impact of the COVID-19 pandemic on college student mental health. Journal of American College Health, 70(5), 1356–1358. https://doi.org/10.1080/07448481.2020.1803882
Martinez, S. M., Frongillo, E. A., Leung, C., & Ritchie, L. (2020). No food for thought: Food insecurity is related to poor mental health and lower academic performance among students in California’s public university system. Journal of Health Psychology, 25(12), 1930–1939. https://doi.org/10.1177/1359105318783028
McKelvey, R., & Zavoina, W. (1975). A statistical model for the analysis of ordinal level of dependent variables. Journal of Mathematical Sociology, 4(1), 103–120. https://doi.org/10.1080/0022250X.1975.9989847
Meza, A., Altman, E., Martinez, S., & Leung, C. W. (2019). “It’s a feeling that one is not worth food”: A qualitative study exploring the psychosocial experience and academic consequences of food insecurity among college students. Journal of the Academy of Nutrition Dietetics, 119(10), 1713–1721. https://doi.org/10.1016/j.jand.2018.09.006
Mulrenan, P., Atkins, J., & Cox, S. (2018). ‘I get up in the night to cry’: The impact of homelessness on higher education students in London, UK. Critical Social Policy, 38(1), 143–154. https://doi.org/10.1177/0261018317724524
Nazmi, A., Martinez, S., Byrd, A., Robinson, D., Bianco, S., Maguire, J., Crutchfield, R. M., Condron, K., & Ritchie, L. (2019). A systematic review of food insecurity among U.S. students in higher education. Journal of Hunger & Environmental Nutrition, 14(5), 725–740. https://doi.org/10.1080/19320248.2018.1484316
Nikolaus, C. J., An, R., Ellison, B., & Nickols-Richardson, S. M. (2020). Food insecurity among college students in the United States: A scoping review. Advances in Nutrition, 11(2), 327–348. https://doi.org/10.1093/advances/nmz111
Nix, A. N., Bertrand Jones, T., Daniels, H., Hu, P., & Hu, S. (2021). “There’s so much that we’re Doing”: How Florida college system institutions address basic needs insecurity among students. Community College Review. Advance online publication. https://doi.org/10.1177/00915521211047674
Paul, P., Pennell, M. L., & Lemeshow, S. (2013). Standardizing the power of the Hosmer Lemeshow goodness of fit test in large data sets. Statistics in Medicine, 32(1), 67–80. https://doi.org/10.1002/sim.5525
Peikes, D. N., Moreno, L., & Orzol, S. M. (2008). Propensity score matching. The American Statistician, 62(3), 222–231. https://doi.org/10.1198/000313008X332016
Raynor, Jr., W. J. (1983). Caliper pair-matching on a continuous variable in case-control studies. Communications in Statistics—Theory and Methods, 12(13), 1499–1509. https://doi.org/10.1080/03610928308828546
Ro, H. K., & Bergom, I. (2020). Expanding our methodological toolkit: Effect coding in critical quantitative studies. New Directions for Student Services, 2020(169), 87–97. https://doi.org/10.1002/ss.20347
Rubin, D. B. (1973). The use of matched sampling and regression adjustment to remove bias in observational studies. Biometrics, 29(1), 185–203. https://doi.org/10.2307/2529685
Rubin, D. B. (2001). Using propensity scores to help design observational studies: Application to the Tobacco litigation. Health Services and Outcomes Research Methodology, 2(3–4), 169–188. https://doi.org/10.1023/A:1020363010465
Salimi, N., Gere, B., Talley, W., & Irioogbe, B. (2021). College students mental health challenges: Concerns and considerations in the COVID-19 pandemic. Journal of College Student Psychotherapy. Advance online publication. https://doi.org/10.1080/87568225.2021.1890298
Schwartz, V., & Kay, J. (2009). The crisis in college and university mental health. Psychiatric Times, 26(10), 32–34.
Senate Bill 5738. (2019). 66th Legislature, State of Washington. https://app.leg.wa.gov/billsummary?BillNumber=5738&Initiative=false&Year=2019#documentSection
Smalley, A. (2021). Higher education responses to coronavirus (COVID-19). National Conference of State Legislatures.
Smith, R., & Knechtel, L. (2020). When student housing is a car: College and homeless. Journal of Student Affairs Research and Practice, 57(2), 322–337. https://doi.org/10.1080/19496591.2019.1671854
Son, C., Hegde, S., Smith, A., Wang, X., & Sasangohar, F. (2020). Effects of COVID-19 on college students’ mental health in the United States: Interview survey study. Journal of Medical Internet Research, 22(9), e21279. https://doi.org/10.2196/21279
Soria, K. M., & Horgos, B. (2021). Factors associated with college students’ mental health during the COVID-19 pandemic. Journal of College Student Development, 62(2), 107–113. https://doi.org/10.1353/csd.2021.0024
Soria, K. M., Horgos, B., & Shenouda, J. D. (2022). Disparities in college students’ financial hardships during the COVID-19 pandemic. Journal of Student Affairs Research and Practice. Advance online publication. https://doi.org/10.1080/19496591.2022.2046597
Soria, K. M., Kelling, C., Mossinghoff, M., & Beahm, R. (2022). First-generation college students’ mental health during the COVID-19 pandemic. Journal of First-Generation Student Success, 2(2), 97–117. https://doi.org/10.1080/26906015.2022.2070442
Spitzer, R. L., Kroenke, K., Williams, J. B. W., & Lӧwe, B. (2006). A brief measure for assessing generalized anxiety disorder. Archives of Internal Medicine, 166(10), 1092–1097. https://doi.org/10.1001/archinte.166.10.1092
Stebleton, M. J., Soria, K. M., & Huesman, Jr., R. L. (2014). First-generation students’ sense of belonging, mental health, and use of counseling services at public research universities. Journal of College Counseling, 17(1), 6–20. https://doi.org/10.1002/j.2161-1882.2014.00044.x
The Hope Center for College, Community, and Justice. (2021). #RealCollege 2021: Basic needs insecurity during the ongoing pandemic. https://hope.temple.edu/sites/hope/files/media/document/HopeSurveyReport2021.pdf
The Hope Center for College, Community, and Justice. (2022). The #RealCollege Survey database-v1. Temple University.
Ulrich, A. K., Full, K. M., Cheng, B., Gravagna, K., Nederhoff, D., & Basta, N. E. (2021). Stress, anxiety, and sleep among college and university students during the COVID-19 pandemic. Journal of American College Health. Advance online publication. https://doi.org/10.1080/07448481.2021.1928143
Umaña, P., Olaniyan, M., Magnelia, S., & Coca, V. (2022). Connecting community college students to SNAP benefits: Lessons learned from a pilot outreach intervention in California. The Hope Center for College, Community, and Justice. https://files.eric.ed.gov/fulltext/ED619928.pdf
U. S. Department of Agriculture, Economic Research Service. (2012). U.S. adult food security survey module: Three-stage design, with screeners. https://www.ers.usda.gov/media/8279/ad2012.pdf
Vilme, H., Duke, N. N., Dokurugu, Y., Akin-Odanye, E. O., Paul, C. J., Kaninjing, E., Lopez, I. A., Matsouaka, R., Brown Speights, J. S., De Leon, J., Sauls, D. L., Ndip, R. N., Amissah, F., Bosworth, H., Warren, C. L., & Muiruri, C. (2022). Food insecurity among university students in the United States amidst the COVID-19 pandemic. Journal of American College Health. Advance online publication. https://doi.org/10.1080/07448481.2022.2082840
Wang, X., Hegde, S., Son, C., Keller, B., Smith, A., & Sasangohar, F. (2020). Investigating mental health of U.S. college students during the COVID-19 pandemic: Cross-sectional survey study. Journal of Medical Internet Research, 22(9), e22817. https://doi.org/10.2196/22817
Wolfson, J. A., Insolera, N., Cohen, A., & Leung, C. W. (2022). The effect of food insecurity during college on graduation and type of degree attained: Evidence from a nationally representative longitudinal survey. Public Health Nutrition, 25(2), 389–397. https://doi.org/10.1017/S1368980021003104
Zimmerman, M., Bledsoe, C., & Papa, A. (2021). Initial impact of the COVID-19 pandemic on college student mental health: A longitudinal examination of risk and protective factors. Psychiatry Research, 305, 114254. https://doi.org/10.1016/j.psychres.2021.114254