An Examination of the Predictive Validity of a Measure of College Admissions Applicants’ Attributions of Success and Failure
Joseph H. Paris* & Rachel Heiser
Temple University
Abstract
Upon the advent of the COVID-19 pandemic, hundreds of higher education institutions in the United States temporarily or permanently adopted test-optional admissions policies. Growth in the number of test-optional institutions and the longstanding criticism of standardized admissions tests as limited and unreliable predictors of college success have led to the use of broader criteria in the college admissions process. Despite the practice of holistic admissions, much of the variance in college outcomes remains unexplained by admissions criteria. Among the potential predictors of postsecondary educational promise are applicants’ causal attributions of the behaviors and events they experience within their environment. Guided by attribution theory of motivation, we examine the predictive validity of a measure of 855 admissions applicants’ causal attributions of success and failure. The measure, composed of four short-answer questions, was administered as part of a test-optional admissions policy at a large urban research university in the United States. Using hierarchical logistic and linear regression, we find that the measure is valid for use across student subgroups. The attribution score derived from the measure makes a statistically significant but nominal contribution to the prediction of four-year bachelor’s degree completion. We also find that the attribution score does not make a statistically significant nor practical contribution to the prediction of cumulative undergraduate grade point average and five-year degree completion. We offer recommendations for higher education and enrollment management professionals and directions for future research.
* Contact: paris@temple.edu

© 2022 Paris & Heiser. This open access article is distributed under a Creative Commons Attribution 4.0 License (https://creativecommons.org/licenses/by/4.0/)
Keywords: test-optional admissions, attribution theory, predictive validity, hierarchical logistic regression, hierarchical linear regression
An Examination of the Predictive Validity of a Measure of College Admissions Applicants’ Attributions of Success and Failure
Access to and completion of postsecondary education are of critical importance given the individual and societal benefits associated with bachelor’s degree attainment (Hout, 2021; Ma et al., 2019). The process by which applicants are selected for admission serves as a key gateway to postsecondary education. Fundamental to college admissions are the evaluative criteria used to make predictions about applicants’ likelihood of success in college. Despite the need to make admissions decisions reliably and accurately, studies have identified differential prediction bias (Aguinis et al., 2016; Fleming, 2002; Young & Kobrin, 2001) and other validity concerns with the criteria traditionally used in college admissions such as standardized admissions test scores (Atkinson & Geiser, 2009; Blau et al., 2004; Soares, 2012; Zwick, 2002, 2017; Zwick & Green, 2007).
Research suggests that standardized admissions test scores (e.g., SAT, ACT) predict a limited range of postsecondary educational outcomes, primarily first-year undergraduate grade point average (UGPA), minimizing their utility in college admissions in which the prediction of performance beyond the first year of undergraduate study is a valuable objective (Burton & Ramist, 2001; Camara & Kimmel, 2005; Hoffman & Lowitzki, 2005; Kobrin et al., 2008). Additionally, scholars suggest that utilizing predictive tools such as standardized test scores can exacerbate race and class-based disparities in postsecondary educational access (Camara & Kimmel, 2005; Soares, 2012; Zwick, 2002, 2017). Scholars have also noted that standardized admissions test scores measure cognitive abilities, yet success in college demands a variety of cognitive and non-cognitive attributes (Camara & Kimmel, 2005; Krumrei-Mancuso et al., 2013; Robbins et al., 2004, 2006; Sedlacek, 2004, 2011, 2017; Sommerfield, 2011; Sternberg, 2010; Sternberg et al., 2012; Thomas et al., 2007; Zwick, 2002, 2017). Additionally, previous research has critiqued other criteria commonly used for admissions decision-making such as high school grade point average (HSGPA) and course grades as inconsistent representations of college readiness across high schools (Allensworth & Clark, 2020; Buckley et al., 2018; Perna & Jones, 2013; Zwick & Himelfarb, 2011) due to wide variability in high school course grading standards (Atkinson & Geiser, 2009; Camara & Kimmel, 2005) and differences in the quantity and quality of the resources at the high schools applicants attend (Rothstein, 2004; Zwick & Himelfarb, 2011). Much of the variance in important college outcomes such as UGPA and bachelor’s degree completion remains unexplained by traditional admissions criteria (Atkinson & Geiser, 2009; Kobrin et al., 2008).
Initially adopted primarily by small private liberal arts colleges, “test-optional” admissions policies deemphasize the consideration of admissions test scores and “test-free” policies forgo the use of test scores as admissions criteria. Recognition that standardized admissions test scores may engender barriers to postsecondary education and provide limited insight into applicants’ potential for success in college has contributed to the growing practice of holistic admissions review (Bastedo et al., 2018) and the proliferation of test-optional policy adoption (Furuta, 2017; Lucido, 2018). Institutions have also been motivated to implement test-optional policies to increase admissions selectivity, promote access to postsecondary education, and enhance campus diversity by attracting a larger and broader applicant pool (Belasco et al., 2015; Lucido, 2018; Soares, 2012; Syverson et al., 2018; Zwick, 2017). Additionally, the COVID-19 (coronavirus disease 2019) pandemic prompted hundreds of institutions to introduce test-optional admissions policies on a permanent or temporary basis due to public health regulations that restricted the availability of admissions testing (FairTest, 2021). The disproportionate effects of the COVID-19 pandemic (Calarco et al., 2021; Gracia, 2020; Molock & Parchem, 2021; Power, 2020) and the growth in test-optional admissions policies (Furuta, 2017; Lucido, 2018) underscore the need for the identification of variables that reliably and accurately contribute to the explanation of the variance in college outcomes. Understanding how applicants’ personal characteristics and backgrounds relate to success in college is of particular importance as institutions develop holistic admissions models that deemphasize standardized admissions test scores. Amid an evolving higher education landscape, it is essential for institutions to account for a greater percentage of the variance in educational outcomes by assessing the psychosocial attributes and motivational dimensions of those who seek admission to college (Hossler et al., 2019; Pietrafetta, 2021).
According to Coleman and Keith (2018), the individualized holistic review of an admissions application includes the “consideration of multiple, intersecting contextual factors that, in combination, uniquely define and reflect accomplishments and potential contributions of each applicant in light of his or her background and circumstances” (p. 4). These factors commonly include individuals’ “non-cognitive” or “non-academic” attributes, characteristics, and experiences that are distinct from their intelligence, knowledge, and reasoning skills and abilities (Camara & Kimmel, 2005; Kalsbeek et al., 2013; Kyllonen, 2005; Kyllonen et al., 2014; Sedlacek, 2004, 2011, 2017; Sternberg, 2010; Sternberg et al., 2012; Thomas et al., 2007; Zwick, 2017). In the context of college admissions, applicants’ personality, attitudes, and personal background and experiences are often demonstrated through personal statements, letters of recommendation, and interviews (Rosinger et al., 2021), but are not widely measured using psychometric instruments despite several noteworthy attempts to validate new instruments designed to measure applicants’ non-academic attributes (e.g., Duckworth et al., 2007; Le et al., 2005; Robbins et al., 2004, 2006; Schmitt et al., 2009; Sedlacek, 2004, 2017; Sternberg et al., 2012; Thomas et al., 2007). The multidimensional nature of college suggests that non-academic factors may be useful predictors of success beyond the first year of undergraduate study (Hossler et al., 2019; Kalsbeek et al., 2013; Kyllonen, 2005; Kyllonen et al., 2014). Among the range of possible non-academic factors related to educational outcomes, attributional tendencies have important implications for achievement motivation and educational performance given their frequent association with perceived ability and effort (Graham, 2020; Weiner, 1985, 1986, 2010). Causal attribution is a concept used to understand the processes by which individuals explain the causes of the behaviors and events they experience within their environment (Anderman, 2020; Graham, 2020; Heider, 1958; Weiner, 1985, 1986, 2010). Therefore, the validation of a measure of applicants’ causal attributions is a promising direction for predicting college outcomes.
The purpose of our study is to examine the validity of a measure of admissions applicants’ attributions of successes and failures to predict cumulative UGPA and bachelor’s degree completion within four and five years of enrollment. We extend the findings of previous studies (e.g., Allen et al., 2009; Farruggia et al., 2018; Gordeeva & Osin, 2011; Hossler et al., 2019; Le et al., 2005; Robbins et al., 2004, 2006; Schmitt et al., 2009; Sedlacek, 2004, 2007; Thomas et al., 2007) by using attribution theory of motivation (Weiner, 1985, 1986, 2010) to investigate whether attributional scores derived from applicants’ responses to essay questions are statistically significant predictors of important educational outcomes beyond their first year of undergraduate study. Our study is designed to address the following research questions:
- 1. Is the measure of attributions of successes and failures differentially correlated with cumulative UGPA, and four- and five-year bachelor’s degree completion across applicant subgroups?
- 2. Is the measure of attributions of successes and failures a statistically significant predictor of UGPA?
- 3. Is the measure of attributions of successes and failures a statistically significant predictor of four- and five-year bachelor’s degree completion?
Literature Review
Previous studies have investigated the use of a wide range of criteria and evaluative methodologies in the undergraduate admissions process. These criteria include, but are not limited to, high school course grades, HSGPA, admissions test scores, non-academic attributes, and personal background characteristics. Despite the variety of criteria commonly utilized for admissions decision-making, the most predictive admissions models only account for approximately 21% of the variance in educational outcomes such as cumulative UGPA and bachelor’s degree completion (Kobrin et al., 2008). Noteworthy efforts have attempted to validate non-cognitive instruments developed to predict undergraduate student success. Although developed prior to the COVID-19 pandemic, measures such as the Student Readiness Inventory (SRI; Le et al., 2005) and Noncognitive Questionnaire (NCQ; Sedlacek, 2004) represent efforts to reconfigure college admission decision-making methodologies in an environment with less emphasis on standardized admissions test scores. We draw upon these psychometric advancements and the literature on college admissions and student motivation to guide our investigation.
Traditional Criteria in College Admissions
Traditionally, the predominant college admissions criteria represent applicants’ preadmission academic performance and cognitive ability as demonstrated by HSGPA and admissions test scores, respectively (Atkinson & Geiser, 2009; Brookhart et al., 2016). However, studies suggest that these criteria are inconsistent predictors of educational outcomes, and their utility is primarily limited to the prediction of first-year UGPA (Camara & Kimmel, 2005; Hoffman & Lowitzki, 2005; Kobrin & Patterson, 2011). Studies also suggest that standardized test scores (e.g., SAT, ACT) are differentially predictive such that scores underpredict or overpredict first year UGPA for certain demographics of students (e.g., female students outperform their predicted first-year UGPA; Ancis & Sedlacek, 1997; Freedle, 2003; Kobrin et al., 2008; Santelices & Wilson, 2010). Additionally, research has identified stronger correlations between SAT scores and family income than with first year UGPA (Crosby et al., 2003; Freedle, 2003; Santelices & Wilson, 2010; Soares, 2012; Syverson et al., 2018; Zwick, 2002, 2013, 2017).
High school grades and HSGPA also have limitations as predictors in college admissions. For example, studies have documented grading variability across high schools and individual courses (Allensworth & Clark, 2020; Buckley et al., 2018; Perna & Jones, 2013; Zwick & Himelfarb, 2011). Further, high school grades may not be representative of course rigor and may not reflect an applicant’s academic readiness for college given the variability in school resources and types (Rothstein, 2004; Zwick & Himelfarb, 2011) and the multifaceted nature of college readiness (Conley, 2010, 2011; Kyllonen et al., 2014; Le et al., 2005; Sedlacek, 2011; Sommerfield, 2011). The COVID-19 pandemic presented new challenges with specific implications for the reliability of high school course grades and HSGPA such as the introduction of pass/fail systems, altered curricula, and transition to various modes of online and in-person learning (Boeckenstedt, 2021).
The findings of these previous studies demonstrate the limitations of traditional admissions criteria as predictors of college student success beyond the first year of undergraduate study. Increasingly, college success is gauged by longer-term educational outcomes such as enrollment persistence and degree completion which require a combination of cognitive (e.g., knowledge, reasoning, intellectual ability) and non-cognitive (e.g., achievement motivation, resilience, self-efficacy) attributes. Given the documented significance of academic momentum and degree completion (Adelman, 2006), there is a need to identify variables that reliably and accurately contribute to the prediction of college student success beyond the first year of undergraduate study.
Non-academic Factors in College Admissions
Since the 1980s, an increasing number of institutions have adopted test-optional admission policies to attract a larger quantity of and more diverse applicants (FairTest, 2021; Lucido, 2018; Syverson et al., 2018; Zwick, 2017). Correspondingly, there has been expanded use of holistic admissions models inclusive of non-cognitive and non-academic factors as predictors of college student success (Bastedo et al., 2018; Furuta, 2017). Importantly, Kyllonen (2005) and Sommerfield (2011) note that many non-cognitive factors involve cognition. We use the term “non-academic factors” to differentiate variables related to adjustment, motivation, and attitudes from traditional academic criteria used in college admissions, predominantly standardized test scores, HSGPA, and high school course grades. Kyllonen’s (2005) classification of non-academic factors in college admissions is a useful framework for considering the range of applicants’ attributes considered as part of a holistic admissions process. Kyllonen’s (2005, p. 4) model includes the following categories of non-academic factors:
- • Basic personality factors (extroversion, emotional stability, agreeableness, conscientiousness, openness/intellect, circadian type)
- • Affective competencies (creativity, emotional intelligence, cognitive style, metacognition/confidence)
- • Performance factors (domain proficiency, general proficiency, effort/motivation/engagement, discipline/professionalism, teamwork, leadership, management/organization skills)
- • Attitudinal constructs (self-concept, self-efficacy, attribution tendencies, interests, social attitudes/values/beliefs, ethics/morality, intercultural sensitivity, adaptability/flexibility)
- • Learning skills (study habits, organization, time management, test anxiety, stress/coping).
Hossler et al. (2019) conducted an exploratory study of the assessment of non-academic factors in college admissions using Kyllonen’s (2005) framework as one of three methodological approaches. They found that the two most important factors in college admissions are performance factors and attitudinal constructs. Performance factors included:
levels of engagement, domain proficiency (ability to manipulate specialized knowledge), general proficiency (ability to manipulate and link information across knowledge domains), effort/motivation/engagement (demonstrates willingness to devote extra time to complete a task), discipline/professionalism (degree to which someone avoids negative behaviors), teamwork, leadership (evidence of supervising a task), and management/organization (setting goals and implementing in non-face-to-face settings). (Hossler et al., 2019, p. 846)
Attitudinal constructs included “self-concept, self-efficacy, attribution tendencies, interests, social attitudes/values/beliefs, ethics/morality, intercultural sensitivity, and adaptability/flexibility” (Hossler et al., 2019, p. 846). The reported importance of attitudinal factors in college admissions decision-making supports continued research efforts to gain a more nuanced understanding of these individual non-academic factors as predictors of college student success.
Several studies have attempted to validate non-academic predictors of college student success (e.g., Allen et al., 2009; Farruggia et al., 2018; Gordeeva & Osin, 2011; Le et al., 2005; Robbins et al., 2004, 2006; Schmitt et al., 2009; Sedlacek, 2004, 2007; Thomas et al., 2007). For example, Thomas et al. (2007) conducted a meta-analytic review of the validity of scores on the NCQ across 47 independent samples for predicting academic outcomes including UGPA and enrollment persistence. They found that none of the NCQ scales were adequate predictors of these outcomes and therefore do not recommend its use in admissions practice. Robbins et al. (2006) analyzed a sample of 14,464 students from 48 institutions using hierarchical regression to measure the predictive validity of the SRI, a measure of psychosocial factors. Controlling for institutional effects (e.g., enrollment size, percentage of minority students enrolled, institutional control), student demographic factors (socioeconomic status index, race/ethnicity, gender), and prior academic achievement (HSGPA, ACT scores), the authors tested the effects of motivational and skill, social, and self-management measures on students’ academic performance and persistence. Their findings indicate that a subset of motivational, social, and self-management factors was predictive of UGPA (academic discipline) and enrollment persistence (commitment to college and social connection). The authors suggest future research focus on testing theoretical models for explaining postsecondary educational outcomes that incorporate motivation and self-management factors. In response, we examine the salience of attributions of successes and failures as a predictor of postsecondary educational outcomes.
In a longitudinal study of the predictive validity of non-cognitive predictors of college student performance, Schmitt et al. (2009) found that biographical data and situational judgement measures added incrementally to the prediction of cumulative UGPA. However, the authors did not specifically investigate the predictive validity of causal attributions. Accordingly, we address this gap in the literature.
Attributional Theory of Motivation
Human motivation in the achievement domain can be conceptualized by the sequence of thought processes that accompany and follow an outcome a person perceives as a success or failure (Graham, 2020; Weiner, 1985, 1986, 2010). In educational psychology, of particular interest is understanding how individuals answer questions about themselves and others following positive, negative, or unexpected events (Gendolla & Koller, 2001; Stupnisky et al., 2011). Causal attributions about oneself and others have important implications for achievement motivation and educational performance given their frequent association with perceived ability and effort (Dweck, 2013; Graham, 2020; Weiner, 1985, 1986, 2010).
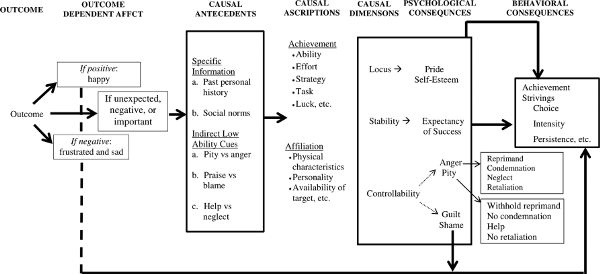
Weiner (1985) categorized causal attributions across three dimensions: locus, stability, and controllability (see Figure 1). Locus of causality refers to an explanation that locates the cause of an outcome as being internal or external to the individual (Graham, 2020; Weiner, 1985, 1986, 2010). One’s ability and the effort they exert are similar in locus as both are internal to the individual. However, ability and effort differ from causes such as luck or task difficulty, both of which are environmental factors that are external to the individual. Stability refers to a cause that is constant or changes over time. Causes such as natural ability are relatively stable over time. However, other causes, such as luck, are temporary and therefore are considered unstable. Controllability refers to the extent to which causes are random or can be influenced by an individual or others. According to Dweck and Leggett (1988), stability and controllability may vary based on a student’s mindset. Additionally, they suggest that controllability explains the positive function of mindset in failure situations. For example, students with a growth mindset may be more likely to perceive a cause of failure as controllable which can help them overcome failure or challenging circumstances (Song et al., 2020).
Figure 1. Weiner’s (1986) Attribution Model
To frame our study, we operationalized causal attributions of successes and failures according to the following definition advanced by Kaplan (2015):
Attributions reflect the characteristics of someone who accredits success and failure to controllable and malleable causes (e.g., effort as well as strategies). Attributions are cognitive explanations of the causes of events in the world that reflect the person’s ontological and epistemological explicit and implicit assumptions. When concerned with the person’s own experiences of success and of failure, attributions have been related to emotions, future expectations of success and failure, motivation, and achievement. An adaptive attributional pattern involves the attribution of success and failure to malleable and controllable causes that are specific to particular situations, which the person can harness in order to change future outcomes in similar situations. A maladaptive attributional pattern involves the attribution of success and of failure to stable causes that are beyond the individual’s control. (p. 1–2)
The measurement of causal attributions has potential utility in college admissions as “expectancies affect subsequent performance in part because they influence how hard people try and how long they persist” (Graham, 2020, p. 5). For example, ability is frequently classified as an internal, stable, and uncontrollable characteristic. When a person attributes failure to their low ability, they may perceive this as a persistent characteristic that is beyond their personal control. Conversely, effort is also internal, but unstable and controllable. Therefore, failure attributed to low effort may be perceived as a characteristic that can be influenced by an individual’s own behavior (Graham, 2020). Individuals who attribute failure to a stable cause often feel an emotion comparable to hopelessness (Weiner, 1985), although few studies have explored this emotion in achievement contexts (Graham, 2020). However, there is evidence that high academic self-efficacy is associated with achievement in academic settings (Han et al., 2017; Robbins et al., 2004). Our study contributes to the understanding of the relationship between causal attributions of success and failure and achievement in an educational context.
Methods
As part of a test-optional admissions process at a large, urban public research university located in the Northeastern United States (hereinafter referred to as the “study site”), applicants submitted responses to four short-answer essay questions that comprised a measure of applicants’ motivational-developmental attributes. For the purposes of our study, we focused exclusively on the components of the measure that capture applicants’ attributions of successes and failures. To answer our research questions, we analyzed observational panel data using descriptive and correlational statistics and hierarchical multivariate regression to examine the validity of the measure as a predictor of applicants’ UGPA and bachelor’s degree completion within four- and five-years following their enrollment at the study site.
Participants and Data Collection
We analyzed admissions and academic performance data collected from 885 undergraduate test-optional admissions applicants who were admitted and enrolled as first-year students at the study site for the Fall 2015 semester. For consistency, we refer to these participants as “applicants” even though they enrolled at the study site. We were provided deidentified panel data by the Institutional Research and Assessment Office at the study site for the Fall 2015 through Summer 2020 terms (i.e., five academic years). We decided not to expand our dataset beyond the Summer 2020 term given the potential impact of COVID-19 on our outcomes of interest. Applicants with a self-reported race of American Indian, Multiple Ethnicities, Pacific Islander, or Unknown or a status of International were categorized as “Other” due to the limited racial/ethnic representativeness of the sample (see Table 1). This grouping may obscure measurable subgroup differences should we have obtained a larger sample. Additionally, we retained incongruent designations of race (e.g., African American and White) as these categories reflect those in the dataset provided by the study site.
Table 1. Descriptive Statistics on the Sample and Population
|
Sample |
Population |
|||
|---|---|---|---|---|
|
Frequency |
Percent |
Frequency |
Percent |
|
|
Gender |
||||
|
Female |
606 |
68.5 |
2,683 |
54.7 |
|
Male |
279 |
31.5 |
2,223 |
45.3 |
|
Race |
||||
|
African American |
210 |
23.7 |
608 |
12.4 |
|
Asian |
97 |
10.9 |
552 |
11.3 |
|
Hispanic |
89 |
10.1 |
332 |
6.8 |
|
Other |
84 |
9.5 |
736 |
15.0 |
|
White |
405 |
45.8 |
2,678 |
54.6 |
|
Pell Grant Recipient Status |
||||
|
Pell Recipient |
391 |
44.2 |
1,425 |
29.0 |
|
Pell Non-Recipient |
494 |
55.8 |
3,481 |
71.0 |
Note. n = 885. Percentages do not total to 100% due to rounding. Population refers to all first-year first-time undergraduate students enrolled for the Fall 2015 semester.
Attributions Measure
The measure examined in our study consisted of four short-answer questions developed by a team of administrators and faculty members to capture test-optional admissions applicants’ motivational-developmental attributes (Kaplan et al., 2017). The motivational-developmental constructs assessed using the measure were derived from the social-cognitive motivational (Bandura, 1986, 2006) and constructivist-developmental (Kegan, 1994) perspectives. The constructs included attributions of success and failure, self-awareness, self-concept, self-set goals, coping, self-authorship, and relevant experiences. Each essay question was designed to measure two or more of these constructs.
Kaplan (2015) developed a rubric that included operational definitions for each of the motivational-developmental constructs. Ten individuals were recruited to rate the constructs within applicants’ responses to each essay question. Several rounds of sample essays were rated using the rubric, and the ratings were tested for interrater and intrarater reliability. The rubric was recalibrated based on the results of each round of internal consistency testing. Each time the rubric was recalibrated, the raters received additional training to improve interrater and intrarater reliability.
As part of the undergraduate admissions process at the study site, applicants indicated whether they would like to be considered for standard admissions (i.e., SAT or ACT submission required) or test-optional admissions (i.e., four short-answer essays required in lieu of test scores). Those who applied for test-optional admissions were presented with the four essay questions. The specific attributions construct was measured within two of the four essay questions. The first question asked applicants to (a) describe a recent event when they felt very successful and proud, (b) explain in detail why they felt proud, and (c) indicate how the experience might relate to their future experiences in college. The second question asked applicants to (a) describe a recent event when they felt they had failed, (b) explain the reason for the failure, (c) describe what they did in response to the failure, and (d) consider how this experience might help them in college.
Each essay response was independently rated based on how the applicant articulated each motivational-developmental construct (including attributions). Raters used the following scale with a range from 1 to 10 points to assess the individual constructs within each essay question: 1 point (does not articulate the construct), 4 points (narrowly articulates the construct), 7 points (generally articulates the construct), 10 points (explicitly articulates the construct). If there was a variance greater than five or more points between the two raters, a third individual rated the essay. The score produced by the third rater was accepted and the other two scores were rejected. The accepted score is hereinafter referred to as the Attributions Score (AS) and serves as a predictor variable in our study. Table 2 is a rubric that demonstrates how the attributions construct was operationally defined and scored within each of the two essay questions.
Data Analysis
We conducted several statistical analyses to address our research questions. Before conducting our analyses, we examined the dataset for systematically missing data and extreme univariate outliers. We handled missing cases using default methods, pairwise and listwise deletion for the correlation and regression analyses, respectively. Due to missing data, we deleted thirteen cases (1.44%) from all analyses, six cases from our analysis of UGPA (.68%), and one case (.11%) from our analysis of four- and five-year degree completion.
Next, we tested our data to determine whether they met the assumptions associated with our analytical techniques, correlational and hierarchical multivariate regression analyses. We computed descriptive statistics to understand our sample and contextualize our findings. We also examined the intercorrelations between the predictor variables (applicant demographic characteristics [race, gender, and socioeconomic status as approximated by Pell Grant receipt], HSGPA, and AS) with the outcome variables (UGPA, four-year degree completion, and five-year degree completion). Then, we examined whether there were statistically significant differences between the correlations across applicant subgroups.
Informed by the literature and the results of our correlational analysis, we developed three hierarchical multivariate regression models that corresponded with each of our research questions. For each model, we entered the following sequence of variables into the regression equation: (a) applicants’ self-reported race, self-reported gender, and socioeconomic status (as approximated by Pell Grant receipt), (b) HSGPA to account for applicants’ preadmission academic performance, and (c) AS, an aggregate of the attribution ratings. We dummy coded the categorical variables for applicants’ race, gender, and Pell Grant status using reference categories of White for race, female for gender, and Pell Non-Recipient for Pell Grant status. For our study, “UGPA” served as a continuous variable, “four-year degree completion” served as a dichotomous variable that indicated whether a bachelor’s degree had been conferred in four or fewer years, and “five-year degree completion” served as a dichotomous variable that indicated whether a bachelor’s degree had been conferred in more than four years, but within five years. Given our data types, a hierarchical linear regression was conducted to predict UGPA, and hierarchical logistic regressions were conducted to estimate the probabilities of four- and five-year degree completion.
Table 2. Attributions Rubric
|
Attributions Construct Rating |
||||
|---|---|---|---|---|
|
Essay Question |
1 |
4 |
7 |
10 |
|
Describe a recent event when you felt very successful and proud. Explain in detail why you felt proud and how this experience might relate to your future experiences in college. |
Attributes success to uncontrollable (e.g., luck) and/or unchanging causes (e.g., innate ability, difficulty of subject). |
Attributes success to a combination of controllable (e.g., effort) and uncontrollable (e.g., ability, domain difficulty) causes. |
Attributes success to controllable and malleable causes (e.g., effort) but without situation-specific differentiation. |
Attributes success to controllable and malleable causes (e.g., effort as well as strategies), makes differentiated situation-specific attributions. |
|
Describe a recent event when you felt that you had failed. Explain the reason for the failure, describe what you did, and consider how this experience might help you in college. |
Attributes failure to uncontrollable (e.g., luck) and/or unchanging causes (e.g., innate low ability, difficulty of subject). |
Attributes failure to a combination of controllable (e.g., effort) and uncontrollable (e.g., ability, domain difficulty) causes. |
Attributes failure to controllable and malleable causes (e.g., effort) but without situation differentiation. |
Attributes failure to controllable and malleable causes (e.g., effort as well as inappropriate strategies), makes differentiated situation-specific attributions. |
Note. Source: Kaplan (2015)
Limitations
Our findings should be considered given several limitations. Specifically, our study includes two primary methodological limitations. First, our study was conducted at a single institution and therefore is not representative of the diverse landscape of higher education institutions in the United States. Second, our study involved the analysis of data from one cohort of first-year students across five academic years. Although we examined outcomes beyond the first and second years of undergraduate study, the benefits of higher education include more than those that are educational in nature. For example, we did not explore whether causal attributions may relate to certain career outcomes, levels of student engagement, civic participation, volunteerism, leadership, or other valuable experiences and outcomes associated with postsecondary participation and completion. It is conceivable that causal attributions measured at a single point in time are invalid predictors of long-term outcomes as one’s cognitive processes and perspectives are shaped through self-reflection and the accumulation of life experiences (Bandura, 1994).
Our study also has three primary measurement limitations. First, applicants responded to the essay questions in a high-stakes situation in which responses may have been prone to faking (McFarland & Ryan, 2000, 2006). Second, although numerous rounds of testing, rubric recalibration, and rater training were undertaken to improve the reliability of the attributions measure, essay scoring is suspectable to rater bias (Eckes, 2012). Third, essay responses were not rated based on grammar or writing style. However, it is reasonable to assume that essays with correct spelling, grammar, and punctuation as well as effective clarity of statements, organization of ideas, and cohesiveness may have more effectively articulated the attributions construct leading to a higher rating. Further, given the high-stakes nature of college admissions essays, it is conceivable that applicants attempted to position themselves positively when responding to the essay prompts, likely resulting in upwardly biased scoring on the attributions construct.
Results
Assumption Tests
We tested our data to ensure they met the assumptions associated with correlation analysis, and linear and logistic regression analysis. We excluded 30 extreme univariate outliers for UGPA and one outlier for four- and five-year degree completion from our analyses. Despite the removal of these cases, we determined that the sample size provided adequate statistical power for our analyses. The assumption of singularity was met as it was determined that the predictor variables were not a combination of other predictors. We also confirmed that collinearity statistics were within accepted limits (Tolerance = .932—.991, VIF = 1.019–1.073), indicating that there were no issues of multicollinearity among the variables. An examination of histograms and P-P plots showed that all data points were on or near the line, suggesting that the assumptions of normality, linearity, and homoscedasticity were satisfied (Hair et al., 2018).
Descriptive Statistics
Among the 885 applicants included in our sample, 45.8% identified as White, 68.5% identified as female, and 55.8% did not receive a Pell Grant. Applicants had a mean HSGPA of 3.41 (SD = .35) and UGPA of 2.95 (SD = .70). Forty-nine percent of applicants completed a bachelor’s degree within four years, and 65% completed within five years. Tables 1 and 3 provide summary statistics on the sample and study variables.
Differential Validity of Attributions Score
Our first research question asked whether the AS is differentially correlated with cumulative UGPA, and four- and five-year bachelor’s degree completion. We identified small statistically significant correlations between the AS and all three outcome variables, UGPA (r = .073, p < .05), four-year degree completion (r = .102, p < .01), and five-year degree completion (r = .083, p < .05). Table 3 presents the correlations between the AS and the outcome variables.
Table 3. Means, Standard Deviations, and Intercorrelations between the Study Variables
|
Variable |
M |
SD |
Attributions Score |
HSGPA |
UGPA |
4-Year Completion |
5-Year Completion |
|---|---|---|---|---|---|---|---|
|
Attributions Score |
6.61 |
.80 |
— |
||||
|
HSGPA |
3.41 |
.35 |
-.048 |
— |
|||
|
UGPA |
2.95 |
.70 |
.073* |
.169** |
— |
||
|
4-Year Completion |
.49 |
.50 |
.102** |
.051 |
.563** |
— |
|
|
5-Year Completion |
.65 |
.48 |
.083* |
.050 |
.625** |
.724** |
— |
Note. n = 885. ** p < .01, * p < .05. 4-year and 5-year degree completion are dichotomous variables where 1 = graduated within specified timeframe and 0 = did not graduate within specified timeframe. Point-biserial correlation coefficients are presented for these variables. Missing cases were handled using pairwise deletion. HSGPA = high school grade point average. UGPA = undergraduate grade point average.
To further examine this research question, we examined intercorrelations between the AS and the outcome variables across applicant subgroups. Based on this analysis, we identified small statistically significant correlations between the AS and UGPA for Asian (r = .215, p < .05) and male applicants (r = .118, p < .05). There were small statistically significant correlations between the AS and four-year degree completion for African American (r = .182, p < .01), female (r = .092, p < .05), and male (r = .140, p < .05) applicants. We also identified small statistically significant correlations between the AS and five-year degree completion for African American (r = .170, p < .05) and male (r = .129, p < .05) applicants. Despite statistical significance, when we examined the differences in the correlation coefficients between the AS and the outcome variables across applicant subgroups, we determined that none of the correlations were statistically significantly different from one another. This suggests that the AS is not differentially correlated with the outcome variables across applicant subgroups. Within the bounds of our study, there is evidence that the AS is not a differentially valid predictor of the outcome variables. Table 4 presents the intercorrelations between the AS and the outcome variables by applicants’ demographic characteristics.
Table 4. Correlations between Attributions Score and Outcome Variables by Applicants’ Demographic Characteristics
|
UGPA |
4-Year Completion |
5-Year Completion |
|
|---|---|---|---|
|
Self-Reported Race |
|||
|
African American |
.056 |
.182** |
.170* |
|
Asian |
.215* |
.045 |
.085 |
|
Hispanic |
-.082 |
-.052 |
-.098 |
|
Other |
.064 |
-.014 |
.047 |
|
White |
.019 |
.087 |
.035 |
|
Self-Reported Gender |
|||
|
Female |
.059 |
.092* |
.066 |
|
Male |
.118* |
.140* |
.129* |
|
Pell Grant Recipient Status |
|||
|
Recipient |
.063 |
.082 |
.094 |
|
Non-Recipient |
.031 |
.077 |
.026 |
Note. n = 885. ** p < .01, * p < .05. The variables 4-year and 5-year degree completion are dichotomous where 1 = graduated within specified timeframe and 0 = did not graduate within specified timeframe. Point-biserial correlation coefficients are reported for these dichotomous variables. Missing cases were handled using pairwise deletion. UGPA = undergraduate grade point average.
Attributions Score as a Predictor of UGPA
Our second research question asked whether the AS is a statistically significant predictor of UGPA. The hierarchical linear regression model including applicants’ demographic characteristics, HSGPA, and AS to predict UGPA was statistically significant, R2 = .130, F(8, 878) = 16.310, p = .000, adjusted R2 = .122. However, the addition of AS to the model did not lead to a statistically significant increase in R2, ∆R2 = .002, F(1, 870) = 1.827, p = .177. Our findings indicate that approximately .2% of the variance in UGPA is explained when the AS is added to the regression model. Table 5 presents these results.
Attributions Score as a Predictor of Four- and Five-Year Degree Completion
In the third research question, we asked whether the AS is a statistically significant predictor of four- and five-year bachelor’s degree completion.
Four-Year Degree Completion
The hierarchical logistic regression model including applicants’ demographic characteristics, HSGPA, and AS to predict four-year bachelor’s degree completion was statistically significant, X2(8) = 71.932, p = .000. The model explained approximately 10.4% of the variance in four-year degree completion, Nagelkerke R2 = .104. The full model correctly classified 61.0% of cases with 60.9% sensitivity, 61.1% specificity, a positive predictive value of 59.9%, and a negative prediction value of 62.0%. Despite statistical significance, when the AS was added to the model it contributed .7% to the explanation of the variance in four-year degree completion over and above applicants’ demographic characteristics and HSGPA. This suggests that an increase in the AS is associated with a small, but statistically significant increase in the probability of four-year degree completion, Exp(B) = 1.220, p = .028. Table 6 presents these findings.
Five-Year Degree Completion
The hierarchical logistic regression model including applicants’ demographic characteristics, HSGPA, and AS to predict five-year bachelor’s degree completion was statistically significant, X2(8) = 55.753, p = .000. The model explained approximately 8.4% of the variance in five-year degree completion, Nagelkerke R2 = .084. The full model correctly classified 67.8% of cases with 93% sensitivity, 23% specificity, a positive predictive value of 68.8%, and a negative prediction value of 64.3%. When the AS was added to the model, it contributed .4% to the explanation of the variance in five-year degree completion over and above applicants’ demographic characteristics and HSGPA. However, an increase in the AS is not associated with a statistically significant increase in the probability of five-year degree completion, Exp(B) = 1.158, p = .109. Table 7 presents these findings.
Table 5. Summary of the Hierarchical Linear Regression Predicting UGPA
|
Model 1 |
Model 2 |
Model 3 |
|||||||
|---|---|---|---|---|---|---|---|---|---|
|
B |
β |
SE β |
B |
β |
SE β |
B |
β |
SE β |
|
|
Constant |
3.082 |
.157 |
1.836 |
.155 |
1.582 |
.155 |
|||
|
African American |
-.352 |
-.213** |
.087 |
-.347 |
-.209** |
.086 |
-.342 |
-.207** |
.086 |
|
Asian |
-.230 |
-.103** |
.112 |
-.279 |
-.124** |
.111 |
-.271 |
-.121** |
.111 |
|
Hispanic |
-.128 |
-.054 |
.115 |
-.115 |
-.049 |
.113 |
-.108 |
-.046 |
.114 |
|
Other |
-.064 |
-.026 |
.115 |
-.046 |
-.019 |
.114 |
-.040 |
-.017 |
.114 |
|
Male |
-.248 |
-.164** |
.070 |
-.224 |
-.148** |
.069 |
-.225 |
-.149** |
.069 |
|
Pell Recipient |
.208 |
-.147** |
.071 |
.214 |
.151** |
.070 |
.208 |
.147** |
.070 |
|
HSGPA |
.354 |
.175** |
.032 |
.357 |
.176** |
.032 |
|||
|
Attributions Score |
.038 |
.043 |
.032 |
||||||
Note. n = 879. R2 = .099 for Model 1. R2 = .129, ΔR2 = .030 for Model 2 (p < .001). R2 = .130, ΔR2 = .002 for Model 3 (p < .001). Reference categories: White, female, Pell Grant non-recipients. ** p < .01, * p < .05. HSGPA = high school grade point average. SE = standard error.
Table 6. Summary of the Hierarchical Logistic Regression Predicting Four-Year Degree Completion
|
Model 1 |
Model 2 |
Model 3 |
|||||||
|---|---|---|---|---|---|---|---|---|---|
|
B |
SE |
Exp(B) |
B |
SE |
Exp(B) |
B |
SE |
Exp(B) |
|
|
Constant |
.662** |
.128 |
1.938 |
-.765 |
.711 |
.466 |
-2.173* |
.962 |
.114 |
|
African American |
-.425* |
.187 |
.654 |
-.420* |
.188 |
.657 |
-.400* |
.188 |
.670 |
|
Asian |
-1.096** |
.260 |
.334 |
-1.157** |
.262 |
.314 |
-1.119** |
.263 |
.327 |
|
Hispanic |
-.292 |
.246 |
.747 |
-.278 |
.246 |
.757 |
-.241 |
.248 |
.786 |
|
Other |
-.122 |
.246 |
.885 |
-.103 |
.247 |
.902 |
-.069 |
.249 |
.933 |
|
Male |
-.546** |
.155 |
.579 |
-.520** |
.156 |
.595 |
-.528** |
.156 |
.590 |
|
Pell Grant Recipient |
-.643** |
.154 |
.526 |
-.652** |
.154 |
.521 |
-.626** |
.155 |
.535 |
|
HSGPA |
.417* |
.205 |
1.518 |
.438* |
.206 |
1.549 |
|||
|
Attributions Score |
.199* |
.091 |
1.220 |
||||||
Note. n = 884. B is reported in log-odds units. Nagelkerke R2 = .092 (p < .001) for Model 1. Nagelkerke R2 = .097 (p < .001) for Model 2. Nagelkerke R2 = .104 (p < .001) for Model 3. Reference categories: White, female, Pell Grant non-recipients. ** p < .01, * p < .05. HSGPA = high school grade point average. SE = standard error of B
Table 7. Summary of the Hierarchical Logistic Regression Predicting Five-Year Degree Completion
|
Model 1 |
Model 2 |
Model 3 |
|||||||
|---|---|---|---|---|---|---|---|---|---|
|
B |
SE |
Exp(B) |
B |
SE |
Exp(B) |
B |
SE |
Exp(B) |
|
|
Constant |
.684** |
.167 |
1.981 |
-.573 |
.744 |
.564 |
-1.598 |
.984 |
.202 |
|
African American |
-.555** |
.193 |
.574 |
-.551** |
.193 |
.577 |
-.535** |
.194 |
.586 |
|
Asian |
-.639** |
.243 |
.528 |
-.693** |
.246 |
.500 |
-.663** |
.247 |
.515 |
|
Hispanic |
-.360 |
.256 |
.698 |
-.349 |
.257 |
.706 |
-.321 |
.257 |
.725 |
|
Other |
-.247 |
.262 |
.781 |
-.230 |
.263 |
.795 |
-.202 |
.264 |
.817 |
|
Male |
-.492** |
.158 |
.611 |
-.467 |
.159** |
.627 |
-.473** |
.159 |
.623 |
|
Pell Grant Recipient |
.662** |
.158 |
1.939 |
.669 |
.159** |
1.951 |
.648** |
.159 |
1.912 |
|
HSGPA |
.366 |
.212 |
1.442 |
.383 |
.213 |
1.466 |
|||
|
Attributions Score |
.147 |
.092 |
1.158 |
||||||
Note. n = 884. B is reported in log-odds units. Nagelkerke R2 = .076 (p < .001) for Model 1. Nagelkerke R2 = .080 (p < .001) for Model 2. Nagelkerke R2 = .084 (p < .001) for Model 3. Reference categories: White, female, Pell Grant non-recipients. ** p < .01, * p < .05. HSGPA = high school grade point average. SE = standard error of B.
Discussion
Summary of the Findings
Our findings indicate that the AS is not differentially correlated with UGPA and four- and five-year degree completion across applicant subgroups. Additionally, we did not identify statistically significant differences in the correlations between the predictor and outcome variables across applicant subgroups allowing us to further test the predictive validity of the attributions measure. The findings of our regression analyses revealed that the AS is a small, but statistically significant predictor of four-year degree completion. However, the AS is not a statistically significant predictor of UGPA and five-year degree completion. Given the minimal variance explained by the addition of the AS score in each of the regression models, we conclude that the AS does not make a meaningful or practical contribution to the prediction of UGPA or four- and five-year degree completion over and above the variance in outcomes accounted for by applicants’ demographic characteristics and prior academic performance.
Implications and Future Research
The non-academic factors that likely contribute most to the prediction of college student success include dimensions that are under the student’s control and directly relevant to the experiences and challenges students may encounter in college (Zwick, 2017). Although findings of previous studies suggest that psychosocial and motivational constructs are associated with college performance (e.g., Allen et al., 2009; Duckworth et al., 2007; Poropat, 2009; Richardson et al., 2012; Robbins et al., 2004; Schmitt et al., 2009), we did not find robust validity evidence to support the use of the causal attributions measure we examined, especially given the high-stakes nature of college admissions decision-making and the potential barrier an essay-based measure may present to prospective applicants.
The importance of understanding how a person attributes the events they experience to internal and external causes is emphasized by the longstanding and widespread impact of COVID-19. For example, an admission applicant may attribute poor course grades to their inability to access the technological resources they need to successfully navigate the transition to online learning upon the advent of COVID-19. In this example, the applicant attributes the event (obtaining poor course grades) to an external, uncontrollable, unstable cause (the inaccessibility of requisite technology). Conversely, an applicant may attribute poor grades to their demotivation and disinterest in online learning (an internal controllable unstable cause). In both cases, how the individual attributes the outcome they experience has important educational implications. Because the measurement of causal attributions is only one way to consider how college students make sense of the positive, negative, and unexpected events they experience, we encourage future research to focus on other non-academic factors such as coping which we believe is particularly salient given the profound effects of COVID-19.
As increased attention is paid to equitable educational opportunities and outcomes, our findings serve as a timely reminder that admissions criteria must be used as part of a comprehensive decision-making framework to minimize overreliance on a single measure for which there may be observable subgroup differences. College admissions essays can be used to capture information about applicants’ experiences and background characteristics that are not reflected in course grades and admissions test scores (Atkinson, 2007; Pennebaker et al., 2014). However, admissions criteria used as a replacement for test scores should not be deemed more equitable by default (Zwick, 2017). For instance, our attributions essay questions asked students to consider how their experiences of success and failure may relate to their future experiences in college. Inherent in this question is a potentially misguided assumption that applicants have informed expectations about college, especially as considerable research has revealed racial and socioeconomic disparities in knowledge about postsecondary educational systems and structures (Gast, 2021; McDonough, 1997; Poynton et al., 2021; Roderick et al., 2011; Tierney & Venegas, 2009). Although Alvero et al. (2021) demonstrated that household income and SAT scores are related to essay content, we did not identify a statistically significant correlation between Pell Grant status and the AS. Therefore, we encourage future research that explores the potential relationship between applicants’ demographic characteristics and non-academic factors derived from their written articulations of experiences and perceptions. Additionally, we caution institutions that intend to measure non-academic factors using written personal statements given Alvero et al.’s (2021) findings and the potential disparities ratings derived from written statements may present for applicants of different backgrounds.
Although there is substantial attributional research, few studies have systematically examined race or ethnicity-related variables (Graham, 2020). According to Graham (2020):
One very direct way to study motivation in different racial/ethnic or cultural groups from an attributional perspective is to examine whether there are differences in attribution content or the meaning of disparate attributions or attribution-related emotions in terms of their underlying properties. (p. 9)
Therefore, we encourage institutions to consider the practicality of standardizing the measurement of written expressions of attributions as doing so may obscure important differences in how students express themselves given their linguistic and cultural backgrounds, and unintentionally introduce bias into the admissions decision-making process. For example, what one applicant deems a controllable cause of an event may be perceived differently by another applicant. The high-stakes nature of college admissions requires the use of criteria that remove potential bias from the process by promoting a more holistic view of admissions applicants. Accordingly, we support admissions practices that focus on context relevant factors (e.g., applicants’ high school and neighborhood information), center the lived experiences and social emotional learning of admissions applicants by capturing the qualities and experiences applicants bring to the campus community, and emphasize applicants’ potential from a “distance traveled” (Craig, 2015, 2017) perspective. Specifically, we believe there is promise in dynamically measuring non-academic factors and attributional tendencies as applicants accumulate academic and sociocultural experiences and their academic mindsets (e.g., sense of belonging, self-efficacy) change over time (Farruggia et al., 2018). Such measurement could include periodic administrations of situational judgement tests that present applicants with realistic, hypothetical scenarios they may encounter in college. Such tests could ask them to identify how they would respond to a particular situation or to rank the responses in the order they feel most closely reflects how they would handle the situation. Admissions officers could use the information gleaned from these tests to better understand how applicants’ potential behaviors may align with the mission and values of their institution.
Conclusion
As institutions reconfigure admissions models with less emphasis on standardized admissions test scores, there is increased importance on identifying valid predictors of student success that eliminate existing biases in the admissions process. Our findings suggest that the consideration of non-academic factors in the admissions process may add predictive value and may reflect how admissions applicants navigate the complexities and challenges of contemporary higher education. Specifically, causal attributions as a non-academic factor in the college admissions process may make a valuable contribution to the prediction of student success if measured using a different instrument or methodology, especially given the propensity of rater bias in essay scoring. Therefore, we recommend continued efforts to validate additional predictors but encourage institutions to carefully consider the methods by which they capture and measure psychological constructs, especially those derived from written expressions of complex cognitive processes that accompany or follow negative experiences.
Author Note
Funding
The authors declared no potential conflicts of interest with respect to the research, authorship, and/or publication of this article.
Conflicts of Interest
The authors have no conflicts of interest to declare that are relevant to the content of this article.
References
Adelman, C. (2006). The toolbox revisited: Paths to degree completion from high school through college. U.S. Department of Education.
Aguinis, H., Culpepper, S. A., & Pierce, C. A. (2016). Differential prediction generalization in college admissions testing. Journal of Educational Psychology, 108(7), 1045–1059. https://doi.org/10.1037/edu0000104
Allen, J., Robbins, S. B., & Sawyer, R. (2009). Can measuring psychosocial factors promote college success? Applied Measurement in Education, 23(1), 1–22. https://doi.org/10.1080/08957340903423503
Allensworth, E. M., & Clark, K. (2020). High school GPAs and ACT scores as predictors of college completion: Examining assumptions about consistency across high schools. Educational Researcher, 49(3), 198–211. https://doi.org/10.3102%2F0013189X20902110
Alvero, A. J., Giebel, S., Gebre-Medhin, B., Antonio, A. L., Stevens, M. L., & Domingue, B. W. (2021). Essay content is strongly related to household income and SAT scores: Evidence from 60,000 undergraduate applications (CEPA Working Paper No. 21–03). Stanford Center for Education Policy Analysis. http://cepa.stanford.edu/wp21-03
Ancis, J. R., & Sedlacek, W. E. (1997). Predicting the academic achievement of female students using the SAT and noncognitive variables. College and University, 72(3), 2–8.
Anderman, E. M. (2020). Achievement motivation theory: Balancing precision and utility. Contemporary Educational Psychology, 61(1), 1–7. https://doi.org/10.1016/j.cedpsych.2020.101864
Atkinson, R. C. (2007). Standardized tests and access to American universities. University of California Press.
Atkinson, R. C., & Geiser, S. (2009). Reflections on a century of college admissions tests. Educational Researcher, 38(9), 665–676. https://doi.org/10.3102/0013189X09351981
Bandura, A. (1986). The explanatory and predictive scope of self-efficacy theory. Journal of Social and Clinical Psychology, 4(3), 359–373. https://doi.org/10.1521/jscp.1986.4.3.359
Bandura, A. (1994). Self-efficacy. In V. S. Ramachandran (Ed.), Encyclopedia of human behavior (Vol. 4, pp. 71–81). Academic Press.
Bandura, A. (2006). Guide for constructing self-efficacy scales. In F. Pajares & T. Urdan (Eds.), Self-efficacy beliefs of adolescents (Vol. 5, pp. 307–337). Information Age Publishing.
Bastedo, M. N., Bowman, N. A., Glasener, K. M., & Kelly, J. L. (2018). What are we talking about when we talk about holistic review? Selective college admissions and its effects on low-SES students. The Journal of Higher Education, 89(5), 782–805. https://doi.org/10.1080/00221546.2018.1442633
Belasco, A. S., Rosinger, K. O., & Hearn, J. C. (2015). The test-optional movement at America’s selective liberal arts colleges: A boon for equity or something else? Educational Evaluation and Policy Analysis, 37(2), 206–223. https://doi.org/10.3102%2F0162373714537350
Blau, J. R., Moller, S., & Jones, L. V. (2004). Why test? Talent loss and enrollment loss. Social Science Research, 33(3), 409–434. https://doi.org/10.1016/j.ssresearch.2003.09.002
Boeckenstedt, J. (2021, March 9). Enrollment managers are flying blind. Chronicle of Higher Education. https://www.chronicle.com/article/enrollment-managers-are-flying-blind
Brookhart, S. M., Guskey, T. R., Bowers, A. J., McMillan, J. H., Smith, J. K., Smith, L. F., . . . & Welsh, M. E. (2016). A century of grading research: Meaning and value in the most common educational measure. Review of Educational Research, 86(4), 803–848. https://doi.org/10.3102%2F0034654316672069
Buckley, J., Letukas, L., & Wildavsky, B. (Eds). (2018). Measuring success: Testing, grades, and the future of college admissions. Johns Hopkins University Press.
Burton, N., & Ramist, L. (2001). Predicting success in college: SAT studies of classes graduating since 1980 (College Board Research Report No. 2001–2.). College Board. https://files.eric.ed.gov/fulltext/ED562836.pdf
Calarco, J. M., Meanwell, E., Anderson, E. M., & Knopf, A. S. (2021). By default: How mothers in different-sex dual-earner couples account for inequalities in pandemic parenting. Socius, 7, 1–15. https://doi.org/10.1177/23780231211038783
Camara, W. J., & Kimmel, E. W. (2005). Choosing students: Higher education admissions tools for the 21st century. Lawrence Erlbaum Associates, Inc.
Coleman, A. L., & Keith, J. L. (2018). Understanding holistic review in higher education admissions: Guiding principles and model illustrations. The College Board. https://professionals.collegeboard.org/pdf/understanding-holistic-review-he-admissions.pdf
Conley, D. T. (2010). College and career ready: Helping all students succeed beyond high school. Jossey-Bass.
Conley, D. T. (2011). Redefining college readiness (Vol. 5). Educational Policy Improvement Center. https://www.ct.edu/files/pdfs/p20/RedefiningCollegeReadiness.pdf
Craig, R. (2015). Distance traveled: A new metric for colleges and universities. Forbes. https://www.forbes.com/sites/ryancraig/2015/05/06/distance-traveled-a-new-metric-for-colleges-and-universities/?sh=259af92f3ba4
Craig, R. (2017). A “distance-traveled” model for college admissions. Inside Higher Ed. https://www.insidehighered.com/views/2017/08/11/selective-colleges-should-focus-less-applicants-achievements-and-more-what-theyve
Crosby, F. J., Iyer, A., Clayton, S., & Downing, R. A. (2003). Affirmative action: Psychological data and the policy debates. American Psychologist, 58(2), 93–115. https://doi.org/10.1037/0003-066X.58.2.93
Duckworth, A. L., Peterson, C., Matthews, M. D., & Kelly, D. R. (2007). Grit: perseverance and passion for long-term goals. Journal of Personality and Social Psychology, 92(6), 1087–1101. https://doi.org/10.1037/0022-3514.92.6.1087
Dweck, C. S. (2013). Self-theories: Their role in motivation, personality, and development. Psychology Press.
Dweck, C. S., & Leggett, E. L. (1988). A social-cognitive approach to motivation and personality. Psychological Review, 95(2), 256–273. https://doi.org/10.1037/0033-295X.95.2.256
Eckes, T. (2012). Operational rater types in writing assessment: Linking rater cognition to rater behavior. Language Assessment Quarterly, 9(3), 270–292. https://doi.org/10.1080/15434303.2011.649381
FairTest. (2021). More than 1,830+ schools do not require ACT/SAT scores from current high school seniors applying for fall 2022. National Center for Fair and Open Testing. https://www.fairtest.org/more-1815-schools-do-not-require-actsat-scores-cur
Farruggia, S. P., Han, C. W., Watson, L., Moss, T. P., & Bottoms, B. L. (2018). Noncognitive factors and college student success. Journal of College Student Retention: Research, Theory & Practice, 20(3), 308–327. https://doi.org/10.1177%2F1521025116666539
Fleming, J. (2002). Who will succeed in college? When the SAT predicts Black students’ performance. The Review of Higher Education, 25(3), 281–296. https://doi.org/10.1353/rhe.2002.0010
Freedle, R. (2003). Correcting the SAT’s ethnic and social-class bias: A method for reestimating SAT scores. Harvard Educational Review, 73(1), 1–43. https://doi.org/10.17763/haer.73.1.8465k88616hn4757
Furuta, J. (2017). Rationalization and student/school personhood in US college admissions: The rise of test-optional policies, 1987 to 2015. Sociology of Education, 90(3), 236–254. https://doi.org/10.1177%2F0038040717713583
Gast, M. J. (2021). Reconceptualizing college knowledge: Class, race, and Black students in a college-counseling field. Sociology of Education, 95(1), 43–60. https://doi.org/10.1177/00380407211046053
Gendolla, G. H., & Koller, M. (2001). Surprise and motivation of causal search: How are they affected by outcome valence and importance? Motivation and Emotion, 25(4), 327–349. https://doi.org/10.1023/A:1014867700547
Gordeeva, T. O., & Osin, E. N. (2011). Optimistic attributional style as a predictor of well-being and performance in different academic settings. In I. Brdar (Ed.), The human pursuit of well-being: A cultural approach (pp. 159–174). Springer Science + Business Media. https://doi.org/10.1007/978-94-007-1375-8_14
Gracia, N. J. (2020). COVID-19’s disproportionate impact on communities of color spotlights the nation’s systemic inequities. Journal of Public Health Management and Practice, 26(6), 518–521. https://doi.org/10.1097/PHH.0000000000001212
Graham, S. (2020). An attributional theory of motivation. Contemporary Educational Psychology, 61, 1–11. https://doi.org/10.1016/j.cedpsych.2020.101861
Hair, J. F., Black, W. C., Babin, B. J., & Anderson, R. E. (2018). Multivariate data analysis (8th ed.). Prentice Hall.
Han, C. W., Farruggia, S. P., & Moss, T. P. (2017). Effects of academic mindsets on college students’ achievement and retention. Journal of College Student Development, 58(8), 1119–1134. https://doi.org/10.1353/csd.2017.0089
Heider, F. (1958). The psychology of interpersonal relations. Wiley. https://doi.org/10.1037/10628-000
Hoffman, J. L., & Lowitzki, K. E. (2005). Predicting college success with high school grades and test scores: Limitations for minority students. The Review of Higher Education, 28(4), 455–474. https://doi.org/10.1353/rhe.2005.0042
Hossler, D., Chung, E., Kwon, J., Lucido, J., Bowman, N., & Bastedo, M. (2019). A study of the use of nonacademic factors in holistic undergraduate admissions reviews. The Journal of Higher Education, 90(6), 833–859. https://doi.org/10.1080/00221546.2019.1574694
Hout, M. (2012). Social and economic returns to college education in the United States. Annual Review of Sociology, 38, 379–400. https://doi.org/10.1146/annurev.soc.012809.102503
Kalsbeek, D., Sandlin, M., & Sedlacek, W. (2013). Employing noncognitive variables to improve admissions, and increase student diversity and retention. Strategic Enrollment Management Quarterly, 1(2), 132–150.
Kaplan, A. (2015). Codebook: Motivational-developmental constructs assessed in test optional essays. Unpublished rubric.
Kaplan, A., Pendergast, L., French, B., & Kanno, Y. (2017). Development of a measure of test-optional applicants’ motivational-developmental attributes. Institute of Educational Sciences Proposal.
Kegan, R. (1994). In over our heads: The mental demands of modern life. Harvard University Press.
Kobrin, J. L., & Patterson, B. F. (2011). Contextual factors associated with the validity of SAT scores and high school GPA for predicting first-year college grades. Educational Assessment, 16(4), 207–226. https://doi.org/10.1080/10627197.2011.635956
Kobrin, J. L., Patterson, B. F., Shaw, E. J., Mattern, K. D., & Barbuti, S. M. (2008). The validity of the SAT for predicting first-year college grade point average (College Board Research Report 2008–5). The College Board.
Krumrei-Mancuso, E. J., Newton, F. B., Kim, E., & Wilcox, D. (2013). Psychosocial factors predicting first-year college student success. Journal of College Student Development, 54(3), 247–266. https://doi.org/10.1353/csd.2013.0034
Kyllonen, P. C. (2005). The case for noncognitive assessments. R&D Connections; Educational Testing Service. https://www.ets.org/Media/Research/pdf/RD_Connections3.pdf
Kyllonen, P. C., Lipnevich, A. A., Burrus, J., & Roberts, R. D. (2014). Personality, motivation, and college readiness: A prospectus for assessment and development. ETS Research Report Series, 2014(1), 1–48. https://doi.org/10.1002/ets2.12004
Le, H., Casillas, A., Robbins, S. B., & Langley, R. (2005). Motivational and skills, social, and self-management predictors of college outcomes: Constructing the Student Readiness Inventory. Educational and Psychological Measurement, 65(3), 482–508. https://doi.org/10.1177%2F0013164404272493
Lucido, J. (2018). Understanding the test-optional movement. In J. Buckley, L. Letukas, & B. Wildavsky (Eds.), Measuring success: Testing, grades, and the future of college admissions (pp. 145–170). Johns Hopkins University Press.
Ma, J., Pender, M., & Welch, M. (2019). Education pays 2019: The benefits of higher education for individuals and society. The College Board. https://research.collegeboard.org/pdf/education-pays-2019-full-report.pdf
McDonough, P. M. (1997). Choosing colleges: How social class and schools structure opportunity. State University of New York Press.
McFarland, L. A., & Ryan, A. M. (2000). Variance in faking across noncognitive measures. Journal of Applied Psychology, 85(5), 812–821. https://doi.org/10.1037//0021-9010.85.5.812
McFarland, L. A., & Ryan, A. M. (2006). Toward an integrated model of applicant faking behavior. Journal of Applied Social Psychology, 36(4), 979–1016. https://doi.org/10.1111/j.0021-9029.2006.00052.x
Molock, S. D., & Parchem, B. (2021). The impact of COVID-19 on college students from communities of color. Journal of American College Health. Advance online publication. https://doi.org/10.1080/07448481.2020.1865380
Pennebaker, J. W., Chung, C. K., Frazee, J., Lavergne, G. M., & Beaver, D. I. (2014). When small words foretell academic success: The case of college admissions essays. PloS One, 9(12), e115844. https://doi.org/10.1371/journal.pone.0115844
Perna, L., & Jones, A. (2013). The state of college success for students from underrepresented groups. Routledge.
Pietrafetta, M. (2021). Admission officers should consider resilience. Inside Higher Ed. https://www.insidehighered.com/admissions/views/2021/02/16/covid-19-era-college-admissions-officers-should-pay-attention-resilience
Poropat, A. E. (2009). A meta-analysis of the five-factor model of personality and academic performance. Psychological Bulletin, 135(2), 322–338. https://doi.org/10.1037/a0014996
Power, K. (2020). The COVID-19 pandemic has increased the care burden of women and families. Sustainability: Science, Practice and Policy, 16(1), 67–73. https://doi.org/10.1080/15487733.2020.1776561
Poynton, T. A., Lapan, R. T., & Schuyler, S. W. (2021). Reducing inequality in high school students’ college knowledge: The role of school counselors. Professional School Counseling, 24(1). https://doi.org/10.1177/2156759X211011894
Richardson, M., Abraham, C., & Bond, R. (2012). Psychological correlates of university students’ academic performance: A systematic review and meta-analysis. Psychological Bulletin, 138(2), 353–387. https://doi.org/10.1037/a0026838
Robbins, S. B., Allen, J., Cassillas, A., Peterson, C. H., & Le, H. (2006). Unraveling the differential effects of motivational and skills, social and self-management measures from traditional predictors of college outcomes. Journal of Educational Psychology, 98(3), 598–616. https://doi.org/10.1037/0022-0663.98.3.598
Robbins, S. B., Lauver, K., Le, H., Davis, D., Langley, R., & Carlstrom, A. (2004). Do psychosocial and study skill factors predict college outcomes? A meta-analysis. Psychological Bulletin, 130(2), 261–288. https://doi.org/10.1037/0033-2909.130.2.261
Roderick, M., Coca, V., & Nagaoka, J. (2011). Potholes on the road to college: High school effects in shaping urban students’ participation in college application, four-year college enrollment, and college match. Sociology of Education, 84(3), 178–211. https://doi.org/10.1177%2F0038040711411280
Rosinger, K. O., Sarita Ford, K., & Choi, J. (2021). The role of selective college admissions criteria in interrupting or reproducing racial and economic inequities. The Journal of Higher Education, 92(1), 31–55. https://doi.org/10.1080/00221546.2020.1795504
Rothstein, J. M. (2004). College performance predictions and the SAT. Journal of Econometrics, 121(1–2), 297–317. https://doi.org/10.1016/j.jeconom.2003.10.003
Santelices, M. V., & Wilson, M. (2010). Unfair treatment? The Case of Freedle, the SAT, and the standardization approach to differential item functioning. Harvard Educational Review, 80(1), 106–134. https://doi.org/10.17763/haer.80.1.j94675w001329270
Schmitt, N., Keeney, J., Oswald, F. L., Pleskac, T. J., Billington, A. Q., Sinha, R., & Zorzie, M. (2009). Prediction of 4-year college student performance using cognitive and noncognitive predictors and the impact on demographic status of admitted students. Journal of Applied Psychology, 94(6), 1479–1497. https://doi.org/10.1037/a0016810
Sedlacek, W. E. (2004). Beyond the big test: Noncognitive assessment in higher education. Jossey-Bass.
Sedlacek, W. E. (2011). Using noncognitive variables in assessing readiness for higher education. Readings on Equal Education, 25, 187–205. http://web.augsburg.edu/em/UsingNCV-Sedlacek.pdf
Sedlacek, W. E. (2017). Measuring noncognitive variables: Improving admissions, success and retention for underrepresented students. Stylus Publishing, LLC.
Soares, J. A. (2012). SAT wars: The case for test-optional college admissions. Teachers College Press.
Sommerfeld, A. (2011). Recasting non-cognitive factors in college readiness as what they truly are: Non-academic factors. Journal of College Admission, 213, 18–22.
Song, J., Kim, S. I., & Bong, M. (2020). Controllability attribution as a mediator in the effect of mindset on achievement goal adoption following failure. Frontiers in Psychology, 10, 2943. https://doi.org/10.3389/fpsyg.2019.02943
Sternberg, R. J. (2010). College admissions for the 21st century. Harvard University Press.
Sternberg, R. J., Bonney, C., Gabora. L., & Merrifield, M. (2012). WICS: A model for college and university admissions. Educational Psychologist, 47(1), 30–41. https://doi.org/10.1080/00461520.2011.638882
Stupnisky, R. H., Stewart, T. L., Daniels, L. M., & Perry, R. P. (2011). When do students ask why? Examining the precursors and outcomes of causal search among first-year college students. Contemporary Educational Psychology, 36(3), 201–211. https://doi.org/10.1016/j.cedpsych.2010.06.004
Syverson, S., Franks, V., & Hiss, W. (2018). Defining access: How test-optional works. National Association for College Admissions Counseling. https://www.nacacnet.org/globalassets/documents/publications/research/defining-access-report-2018.pdf
Thomas, L. L., Kuncel, N. R., & Crede, M. (2007). Noncognitive variables in college admissions: The case of the Non-Cognitive Questionnaire. Educational and Psychological Measurement, 67(4), 635–657. https://doi.org/10.1177%2F0013164406292074
Tierney, W. G., & Venegas, K. M. (2009). Finding money on the table: Information, financial aid, and access to college. The Journal of Higher Education, 80(4), 363–388. https://doi.org/10.1080/00221546.2009.11779021
Weiner, B. (1985). An attributional theory of achievement motivation and emotion. Psychological Review, 92(4), 548–573. https://doi.org/10.1037/0033-295X.92.4.548
Weiner, B. (1986). An attributional theory of motivation and emotion. Springer.
Weiner, B. (2010). The development of an attribution-based theory of motivation: A history of ideas. Educational Psychologist, 45(1), 28–36. https://doi.org/10.1080/00461520903433596.
Young, J. W., & Kobrin, J. L. (2001). Differential validity, differential prediction, and college admission testing: A comprehensive review and analysis (College Board Research Report No. 2001–6). The College Board.
Zwick, R. (2002). Fair game: The use of standardized admissions tests in higher education. Psychology Press.
Zwick, R. (Ed.). (2013). Rethinking the SAT: The future of standardized testing in university admissions. Routledge.
Zwick, R. (2017). Who gets in? Strategies for fair and effective college admissions. Harvard University Press.
Zwick, R., & Green, J. G. (2007). New perspectives on the correlation of SAT scores, high school grades, and socioeconomic factors. Journal of Educational Measurement, 44(1), 23–45. https://doi.org/10.1111/j.1745-3984.2007.00025.x
Zwick, R., & Himelfarb, I. (2011). The effect of high school socioeconomic status on the predictive validity of SAT scores and high school grade-point average. Journal of Educational Measurement, 48(2), 101–121. https://doi.org/10.1111/j.1745-3984.2011.00136.x